

Candlestick Pattern analysis is a fundamental aspect of technical analysis in stock charting. Each candle on the chart conveys significant information about market sentiment. Mastering the skill of reading these candles requires time and patience, but it can yield substantial benefits. While there are numerous candlestick patterns, it’s impractical to search for all of them on a chart. In this post, we’ve compiled some of the most influential candlestick patterns that you should be familiar with. Feel free to explore and practice spotting these patterns on various charts and timeframes.
Bullish and Bearish Engulfing Patterns
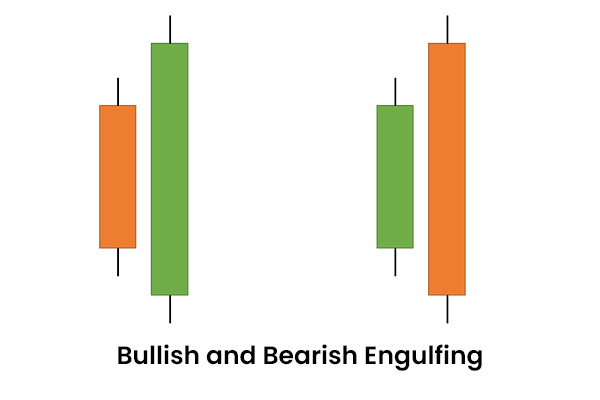
One of the most powerful candlestick patterns widely embraced by traders is the Bullish and Bearish Engulfing pattern. It consists of a short candle followed by a longer one that completely engulfs the short one. The Bullish Engulfing formation begins with a short red candlestick, followed by a taller green-bodied candlestick that opens below and closes above the previous day’s trading range. This indicates that the second day’s prices opened lower than the first day but closed higher. It’s a strong bullish signal, suggesting consideration for a long position. Conversely, a Bearish Engulfing pattern is characterized by a green-bodied candlestick followed by a longer red-bodied one, signaling a bearish trend and prompting consideration of a short position.
Doji Candlestick Pattern
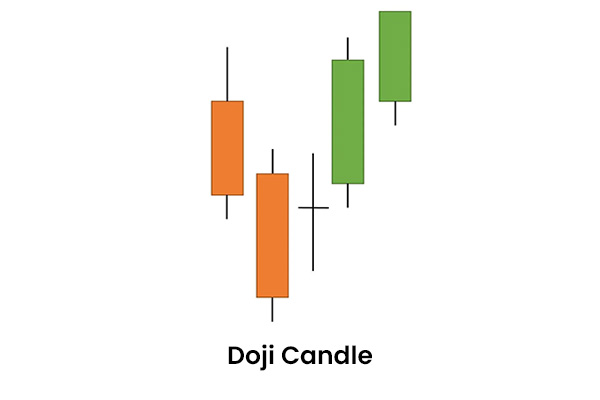
The Doji Candle pattern represents another essential reversal indicator. It features little to no body area, indicating that the opening and closing prices are nearly identical. The lengths of the upper and lower shadows may vary, creating a candlestick that resembles a cross, inverted cross, or plus sign. A Doji pattern during a downtrend, as depicted in the image above, can potentially shift the trend towards a sideways or upward trajectory. Similarly, a Doji during an uptrend can signal a reversal. The Doji indicates a state of confusion between buyers and sellers, signifying that buyers may be exhausted during an uptrend while sellers stand ready to intervene, and vice versa. Different variations of the Doji include the Dragonfly Doji and Gravestone Doji.
Three Black Crows
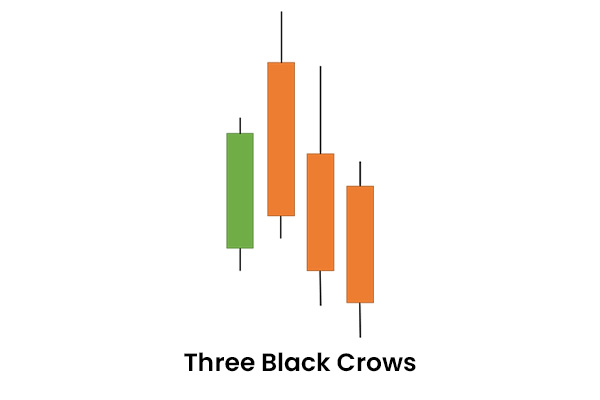
The Three Black Crows pattern is a bearish reversal pattern that occurs at the peak of an uptrend. It features three consecutive red or black candles, each with a lower low than the previous one. These three candles possess elongated bodies and significant participation volume. While this formation is relatively rare, it unmistakably indicates a high likelihood of a sustained downtrend.
Bullish and Bearish Marubozu
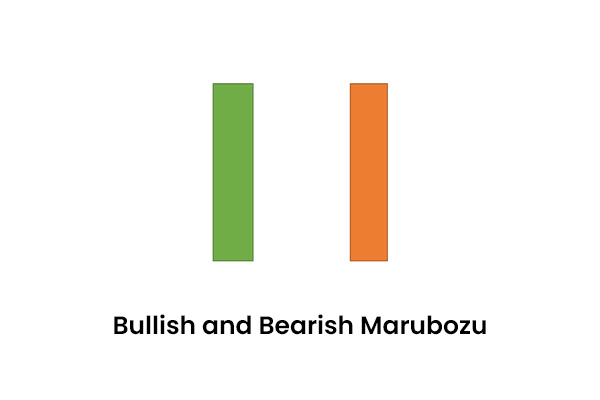
Marubozu patterns are among the most compelling candlestick formations. Marubozu candles lack upper or lower shadows, with the high and low represented by the opening or closing prices. A Green Marubozu forms when the opening price equals the low, and the closing price equals the high. This indicates that buyers remained in control throughout the timeframe. A Red Marubozu forms when the opening price equals the high, and the closing price equals the low, indicating that sellers dominated the entire timeframe.
The Hammer Candlestick Pattern
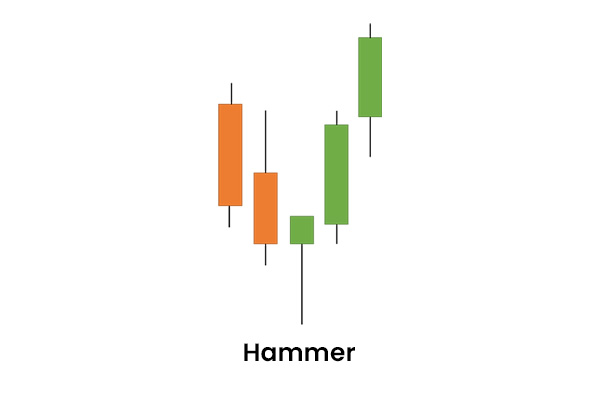
The Hammer is a bullish candlestick pattern that emerges after a prolonged downtrend. It features a small green body with a long lower wick, suggesting that sellers initially pushed the price lower, but buyers regained control by the end of the session. However, it’s essential to seek further bullish confirmation before acting on this pattern. The low of the Hammer indicates that many sellers remain. Additional buying pressure, ideally accompanied by increased trading volume, is needed before taking action. A similar candle pattern appearing during an uptrend is known as a Hanging Man, which signals a potential reversal towards a downtrend.
These are the top five potent candlestick patterns we’ve covered. They offer a high likelihood of success and are widely used by traders worldwide. Nevertheless, it’s important to remember that other patterns should not be disregarded. There are numerous patterns to consider when making trading decisions in the market. If you have any questions or wish to include another pattern in this list, please feel free to reach out.
Explore another intriguing chart pattern below:


9 Comments