
Understanding the Shooting Star Pattern in Trading: As a technical analysis trader, you’ve likely encountered the term ‘shooting star .’ If not, we’re here to explain what it is and how to use it effectively.
Used as a reversal indicator, it signals a potential price drop. Interestingly, it resembles an inverted hammer but appears in an uptrend.
This article covers the shooting star pattern, including its definition, applications, interpretations, and practical examples.
Also Read: Understanding Candlestick Patterns in Stock Analysis
Definition
Price action trading focuses on market movements based on past price changes. This analysis helps traders decide on future asset direction.
Price action trading utilizes tools like price bands, high and low swings, and charts for market observation.
The shooting star pattern, a specific candlestick formation in technical analysis, is a bearish candlestick pattern. It forms when a security opens, rises significantly, and then closes near its opening price.
It’s characterized by a small or non-existent lower shadow and a long upper shadow, appearing near the day’s low.
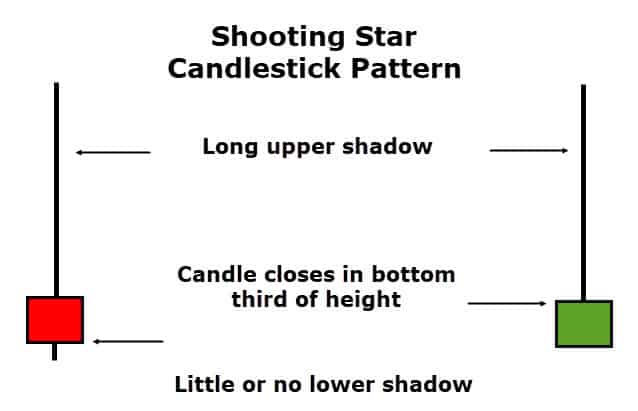
For it to be a shooting star, the pattern must develop amidst a price advance.
Reading the Shooting Star Pattern
The shooting star pattern indicates:
- Potential reversal and the formation of a price top.
- It’s most effective when following at least three consecutive rising candles with higher highs.
- Reflects buying pressure from previous periods.
- Its long upper shadow shows buyers who are now at a loss due to the price drop.
- If prices rise post-shooting star, its range may act as resistance.
Shooting Star Pattern in Action
Below is a daily chart of Cisco Systems, showcasing a shooting star pattern and its predictive power for a downward trend.
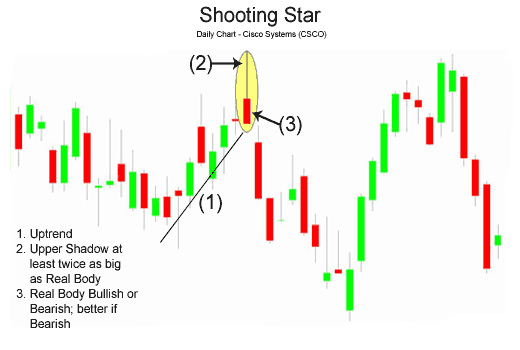
Here it led to a prolonged downward movement.
Implementation
This pattern is ideal for initiating new short positions in the market.
Consider selling futures, buying puts, or selling calls upon spotting this pattern. Pair it with other bearish indicators for stronger confirmation.
It’s also a signal to close long positions.
Also Read: How to plot a candlestick chart in an Excel Sheet?
Concluding Insights
Like other price action trading strategies, this pattern is a vital tool in trading. It’s straightforward to use and recognize.
While effective on its own, combining it with other technical analysis techniques enhances its reliability.