
Get ready to explore the Bullish and Bearish Engulfing Candlestick Pattern Amibroker AFL Code in this post. This handy AFL code is available for free and can be effortlessly imported into Amibroker.

Bullish and bearish engulfing candlestick patterns are key tools in technical analysis, helping traders spot possible trend reversals. A bullish engulfing pattern appears when a small red candle is followed by a larger green one. The green candle’s opening price is lower than the red’s closing price, and its closing price is higher than the red’s opening price. This indicates buyers taking over, hinting at a possible bullish trend reversal.

Conversely, a bearish engulfing pattern is when a small green candle is succeeded by a larger red candle. Here, the red candle’s opening price is above the green’s closing price, and its closing price falls below the green’s opening price. This signals sellers gaining control, suggesting a potential bearish trend reversal. Recognizing these patterns can empower traders to make savvy decisions and capitalize on market shifts.

Further Reading: Understanding Candlestick Patterns in Stock Analysis

Amibroker AFL for Bullish and Bearish Engulfing Patterns

				
					//------------------------------------------------------
//
//  Formula Name:    Bullish and Bearish Engulfing
//  Website:         https://zerobrokerageclub.com/
//------------------------------------------------------

_SECTION_BEGIN("Bullish and Bearish Engulfing");

SetChartOptions(0,chartShowArrows|chartShowDates);
_N(Title = StrFormat("{{NAME}} – {{INTERVAL}} {{DATE}} Open %g, Hi %g, Lo %g, Close %g (%.1f%%) {{VALUES}}", O, H, L, C, SelectedValue( ROC( C, 1 ) ) ));

Plot( Close, "Price", colorWhite, styleCandle );

//Bullish and Bearish Engulfing Candlestick Patterns

// Calculate the body size of the current candle
BodySize = abs(O-C);

// Calculate the body size of the previous candle
PrevBodySize = abs(Ref(O,-1)-Ref(C,-1));

// Check for bullish engulfing pattern
BullishEngulfing = (C > O) AND (O < Ref(O,-1)) AND (C > Ref(C,-1)) AND (BodySize > PrevBodySize);

// Check for bearish engulfing pattern
BearishEngulfing = (O > C) AND (C < Ref(C,-1)) AND (O > Ref(O,-1)) AND (BodySize > PrevBodySize);

// Plot signals
PlotShapes(IIf(BullishEngulfing, shapeSquare, shapeNone),colorGreen, 0, L, Offset=-40);
PlotShapes(IIf(BullishEngulfing, shapeSquare, shapeNone),colorLime, 0,L, Offset=-50);
PlotShapes(IIf(BullishEngulfing, shapeUpArrow, shapeNone),colorWhite, 0,L, Offset=-45);

PlotShapes(IIf(BearishEngulfing, shapeSquare, shapeNone),colorRed, 0, H, Offset=40);
PlotShapes(IIf(BearishEngulfing, shapeSquare, shapeNone),colorOrange, 0,H, Offset=50);
PlotShapes(IIf(BearishEngulfing, shapeDownArrow, shapeNone),colorWhite, 0,H, Offset=-45);

// Add alerts
AlertIf(BullishEngulfing, "Bullish Engulfing", "Bullish Engulfing");
AlertIf(BearishEngulfing, "Bearish Engulfing", "Bearish Engulfing");

_SECTION_END();


A Peek at the Amibroker AFL for Engulfing Patterns

Check out this AFL’s screenshot right here:

Bullish-and-Bearish-Engulfing-Candlestick-Pattern-Amibroker-AFL.

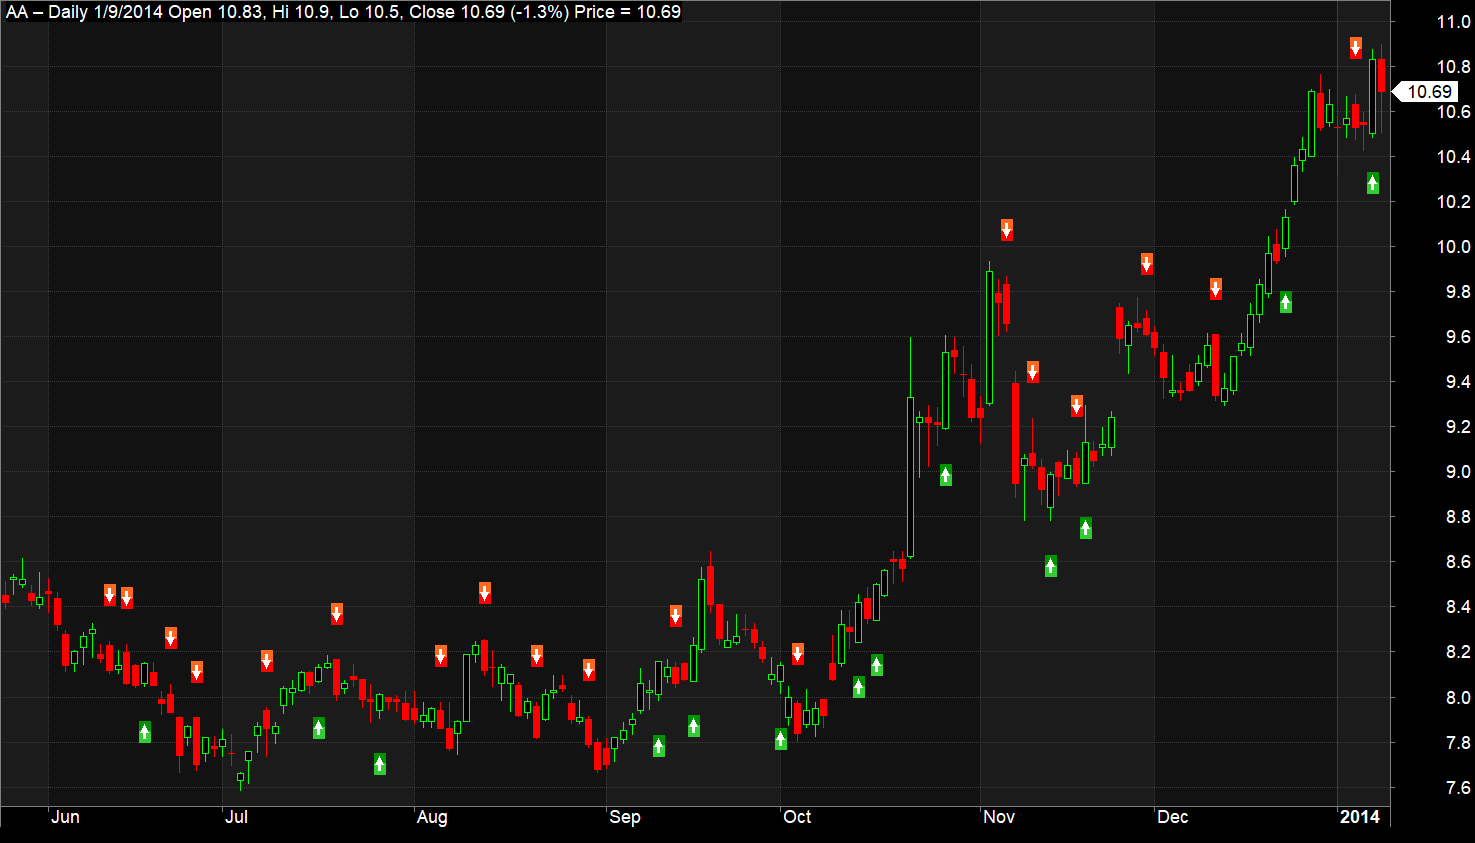
Unpacking the AFL Code

This AFL cleverly calculates candle body sizes using the abs() function and taps into previous candles’ open and close prices with Ref().

For bullish engulfing, the code looks for a higher current close than open, a current open lower than the previous open, a higher current close than the previous close, and a larger current body size than the previous. For bearish engulfing, it’s the opposite: a higher current open than close, a lower current close than the previous close, a higher current open than the previous open, and a bigger current body size than the previous.

When a bullish pattern is found, the code plots a green hollow up arrow and triggers an alert with PlotShapes() and AlertIf(). A bearish pattern discovery leads to a red hollow down arrow and an alert.

This AFL is a powerful tool in Amibroker for pinpointing bullish and bearish engulfing patterns. It not only plots signals but also sets off alerts, helping traders quickly notice potential trend reversals and adapt their strategies accordingly.

Also Read: How to Plot a Candlestick Chart in an Excel Sheet

Leave a Reply