Exploring the Impact of Candlestick Patterns in Technical Analysis
Candlestick patterns are essential tools in technical analysis, offering insights into future price actions of stocks and other financial markets. Among these, the Morning Star Candlestick Pattern is particularly noteworthy.
It is a bullish reversal indicator, often signals a shift from a bearish to a bullish trend. It’s a three-part formation usually seen at the end of a downtrend, suggesting that bearish forces are waning and bullish sentiment is on the rise.
This article aims to provide a detailed guide on the Morning Star Candlestick Pattern. We’ll cover its components, identification methods, and effective application in trading strategies. Additionally, we’ll touch on its limitations and risks in trading scenarios.
By the end of this article, you’ll gain a comprehensive understanding of the Morning Star Candlestick Pattern and learn how to integrate it into your technical analysis toolbox. Let’s get started!
Recommended Reading: Delving Into Candlestick Patterns in Stock Analysis
Decoding the Morning Star Candlestick Pattern
The Morning Star Candlestick Pattern, a key bullish reversal indicator, consists of three distinct candles. It often emerges at the end of downtrends, signaling a shift in momentum from bears to bulls.
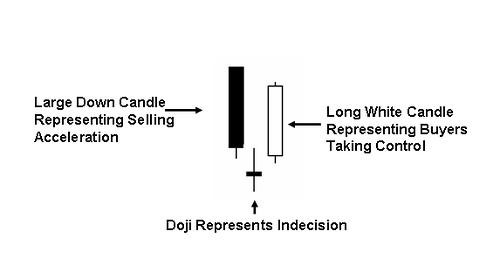
The pattern starts with a bearish candle, indicating ongoing selling pressure. The next candle, small in body, represents market indecision; it could be bullish, bearish, a doji, or a spinning top. The pattern concludes with a bullish candle, marking the ascendance of bullish market sentiment.
Recognized for its reliability in signaling reversals, the Morning Star pattern gains additional significance if the middle candle is a doji, highlighting even greater market indecision.
Beyond the classic Morning Star, variations like the Morning Doji Star and Abandoned Baby patterns also indicate potential bullish reversals, despite differing candle arrangements.
Next, we’ll explore how to spot the Morning Star Candlestick Pattern on trading charts.
Spotting the Morning Star Candlestick Pattern on Charts
Recognizing the Morning Star Candlestick Pattern is crucial for traders. Here’s a straightforward guide to identifying this pattern:
- Search for a Downtrend: The Morning Star pattern typically appears at a downtrend’s conclusion, hinting at a bearish to bullish momentum shift.
- Identify the Initial Bearish Candle: The pattern starts with a bearish candle, reflecting prevalent selling pressure.
- Spot the Indecisive Second Candle: The second candle, small in body, shows market uncertainty. A doji or spinning top here adds significance.
- Find the Bullish Third Candle: The final candle is bullish, symbolizing the rise of bullish momentum.
- Validate the Pattern: Confirming the pattern involves looking for a gap between the second and third candles, a clear indication of a bullish takeover.
Remember, the Morning Star pattern should be part of a broader technical analysis strategy, supplemented by tools like trend lines and support and resistance levels.
Now, let’s discuss how to leverage the Morning Star Candlestick Pattern in trading strategies.
Effective Trading Strategies with the Morning Star Candlestick Pattern
When you encounter the Morning Star pattern, consider these trading strategies:
- Initiate a Buy Position: Upon spotting the pattern at a downtrend’s end, consider going long. Set a stop loss below the pattern’s low and target a significant resistance level for profits.
- Wait for Pattern Confirmation: For a risk-averse approach, wait for additional bullish signals post-pattern, such as a subsequent bullish candle, resistance level breach, or bullish trend line breakout.
- Integrate Other Indicators: Enhance your strategy by combining the Morning Star pattern with indicators like moving averages, RSI, or stochastic oscillators for pattern validation.
- Apply Across Timeframes: Utilize the Morning Star pattern in various timeframes to identify broader trends and short-term trading opportunities.
Be mindful that the Morning Star pattern isn’t a foolproof bullish signal. Employ effective risk management and adhere to your trading plan.
Up next, we’ll discuss the limitations and considerations when using the Morning Star pattern.
Understanding the Limitations and Considerations of the Morning Star Pattern
While valuable, the Morning Star Candlestick Pattern has its limitations and associated risks. Here’s what to keep in mind:
- Be Cautious of False Signals: The pattern may occasionally give misleading signals, especially in volatile markets. Use other technical analysis tools for confirmation.
- Avoid Sole Reliance: Don’t use the Morning Star pattern as your only trading criterion. Incorporate elements like fundamental analysis and market sentiment into your decision-making.
- Mind Emotional Biases: Stay alert to emotional biases that might affect your decisions based on the pattern.
- Consider Market Specifics: The pattern’s effectiveness may vary across different market conditions, such as in highly volatile or low liquidity markets.
To sum up, the Morning Star Candlestick Pattern is a potent tool for technical analysis, but it should be one of many tools in your trading arsenal.
Additional Resources: 3 Accurate Chart Patterns Every Trader Should Know
Final Insights
In conclusion, the Morning Star Candlestick Pattern is an insightful tool for traders aiming to spot bullish reversals. When integrated with a comprehensive technical analysis strategy, it can significantly inform trading decisions.
However, it’s crucial to remember that the Morning Star pattern is not a standalone bullish signal. Adequate risk management and a well-thought-out trading plan are essential when trading based on this pattern.
Additionally, be mindful of the pattern’s limitations and risks, such as false signals and emotional biases, especially in certain market conditions.
Overall, it is a valuable asset in a trader’s toolkit, offering insights that can enhance trading strategies when used judiciously and in conjunction with other analysis methods.
Download an AFL code for this pattern here.