
RSI, or the Relative Strength Index, is a widely used momentum indicator in Technical Analysis. It ranges from 0 to 100 and shows how strong and fast prices are changing. RSI is usually calculated over a 14-day period. When RSI is above 70, it indicates overbought conditions, and when it’s below 30, it signals oversold conditions. However, interpretations may vary depending on your trading style. In this post, we aim to explain how to calculate RSI in an Excel sheet and provide the calculation steps. You can also explore one of our popular trading systems based on RSI and ADX:
Learn more about our Nifty Intraday Strategy using RSI & ADX.
The Relative Strength Index, created by J. Welles Wilder and introduced in 1978, is one of the most widely used oscillator indices.
How is RSI Calculated?
RSI is calculated based on the average gains and losses over a specific time period. For example, if you want to calculate the 14-day RSI and the stock went up on nine days and down on five days, you add up the absolute gains (closing price on a given day minus closing price on the previous day) on each of those nine days. Then, you divide this total by 14 to get the average gains. Similarly, you add up the absolute losses on each of the five days and divide that total by 14 to get the average losses. The ratio of these values (average gains / average losses) is called the relative strength (RS). To ensure that RSI always stays between 0 and 100, the indicator is normalized using the following formula:
RSI = 100 – 100 / (1+RS*) * RS = Average gains / Average losses
Excel Sheet Overview
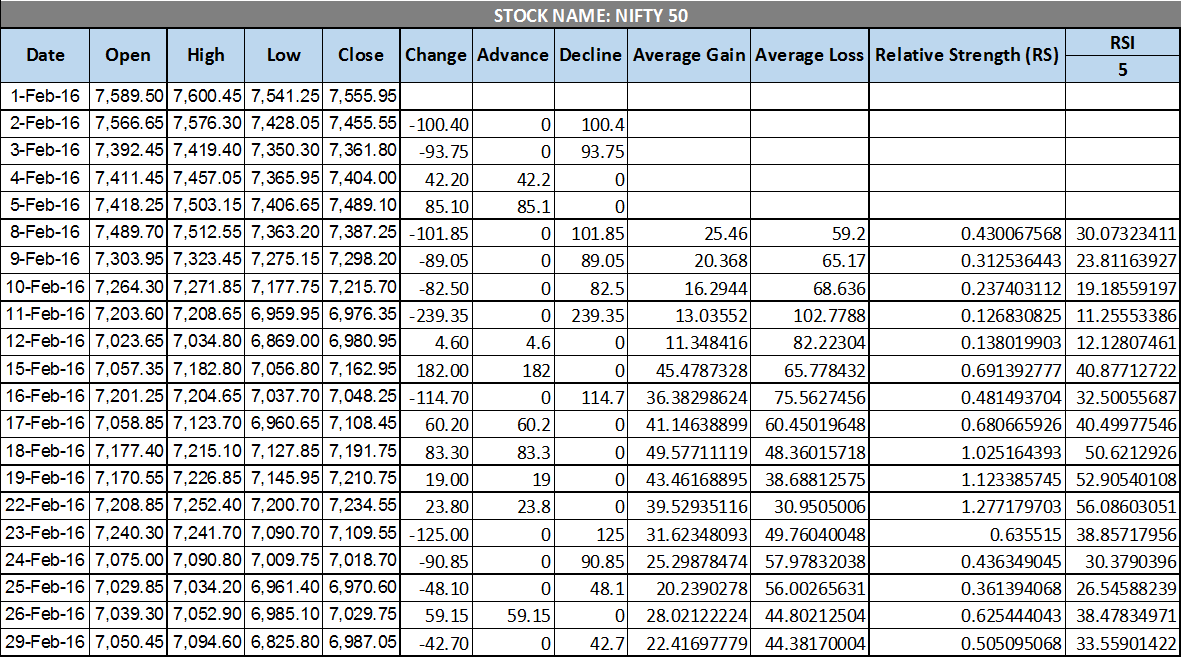
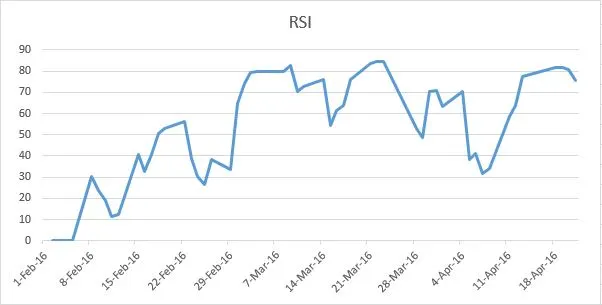
The Excel sheet dynamically calculates RSI based on the specified time periods. You need to manually input the Open, High, Low, and Close data for your chosen stock or index. You can find the calculation formula in the Excel sheet itself. The price chart and RSI chart are embedded in the Excel sheet and will update accordingly.
| Parameter | Description | |
| Worksheet Name | Dynamic RSI | |
| Inputs | Columns A, B, C, D, E | Date, Open, High, Low, and Close for your selected stock or index. |
| Cell L3 | The time period for which RSI should be calculated. The default is 5. | |
| Outputs | Change (Column F) | Change in the stock price from the previous day, which can be positive or negative. |
| Advance/Decline (Columns G, H) | If the change (Column F) is positive, Advance equals the change; otherwise, it’s zero. If the change is negative, Decline equals -change; otherwise, it’s zero. | |
| Average Gain/Loss (Columns I, J) | The average of Advance/Decline for the specified RSI period. | |
| Relative Strength (Column K) | The ratio of Average Gain and Average Loss. | |
| RSI (Column L) | The final RSI value for the given time period. | |
Screenshots
Download Link
You can download the Excel sheet from the link below. Feel free to reach out if you have any questions or comments.