

Price Action trading is the most straightforward form of technical analysis, serving as the foundation for modern trading systems. It involves reading charts to spot breakouts or consolidation phases that can inform your buying and selling decisions. Every chart contains numerous visible patterns that shape price movements, along with various indicators, some rooted in price action and others in momentum and volume. We are excited to introduce a new section on our website dedicated to price action trading, chart patterns, and indicators. We will kickstart it with a highly valuable chart pattern known as the 123 pattern or abc pattern, which forms the basis of the 123 Trading strategy.
Understanding the 123 Trading Strategy
The essence of the 123 Trading Strategy lies in the observation that stock prices often experience minor pullbacks before entering a trend. This reversal pattern indicates the initiation of an uptrend or downtrend. Refer to the diagrams below to grasp the 123 chart pattern.
123 Bullish Scenario

- Point 1 represents the chart’s lowest point, forming the support level.
- Point 2 signals the commencement of a bullish trend, marking the second-highest point on the chart.
- Point 3 denotes a pullback, although it is higher than point 1.
- If the price starts moving upward after touching point 3, a breakout at point 2 signifies a strong buy, particularly when accompanied by substantial volumes confirming the trade.
- Set the stop-loss at Point 3, maintaining a risk-reward ratio of 1:2.
123 Bearish Scenario
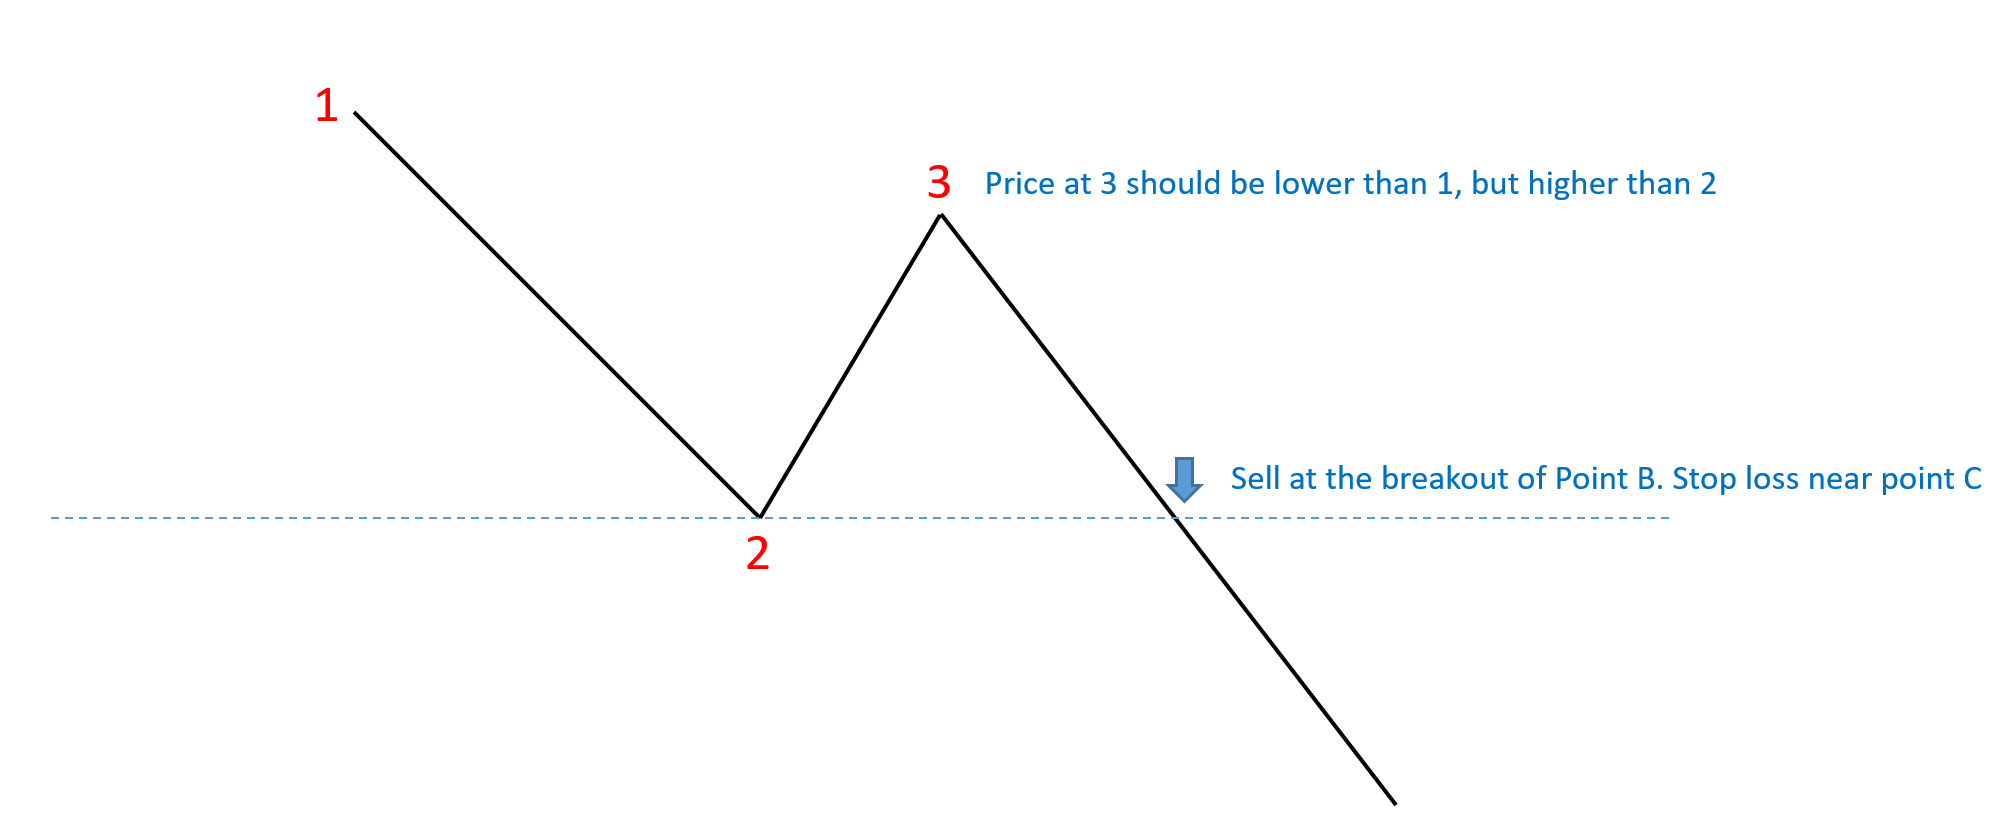
- Point 1 represents the chart’s highest point, forming the resistance level.
- Point 2 indicates the inception of a bearish trend, marking the second-lowest point on the chart.
- Point 3 signifies a pullback, but it is lower than point 1.
- If the price starts moving downward after touching point 3, a breakout at point 2 suggests a strong sell, especially when accompanied by substantial volumes confirming the trade.
- Set the stop-loss at Point 3, maintaining a risk-reward ratio of 1:2.
The Psychology Behind the Pattern
In the bullish scenario, the transition from point 1 to point 2 signifies Bulls stepping in after a period of downtrend or consolidation. Conversely, bears attempt to push down the price after point 2. However, when it forms a low at point 3, bulls regain control and propel prices further upward. Point 3 surpasses point 1, indicating a higher low and signaling bullishness. Breakouts accompanied by high volumes confirm the uptrend, reflecting stronger conviction among buyers. This theory reverses in the bearish scenario.
Risk Management
- Implement a strict stop-loss at point 3 for both Buy and Short trades.
- Set the target at twice the stop-loss to maintain a risk-reward ratio of 1:2.
- Always look for high volumes in the breakout candle.
- To minimize risk, enter at the next day’s open to confirm the trend.
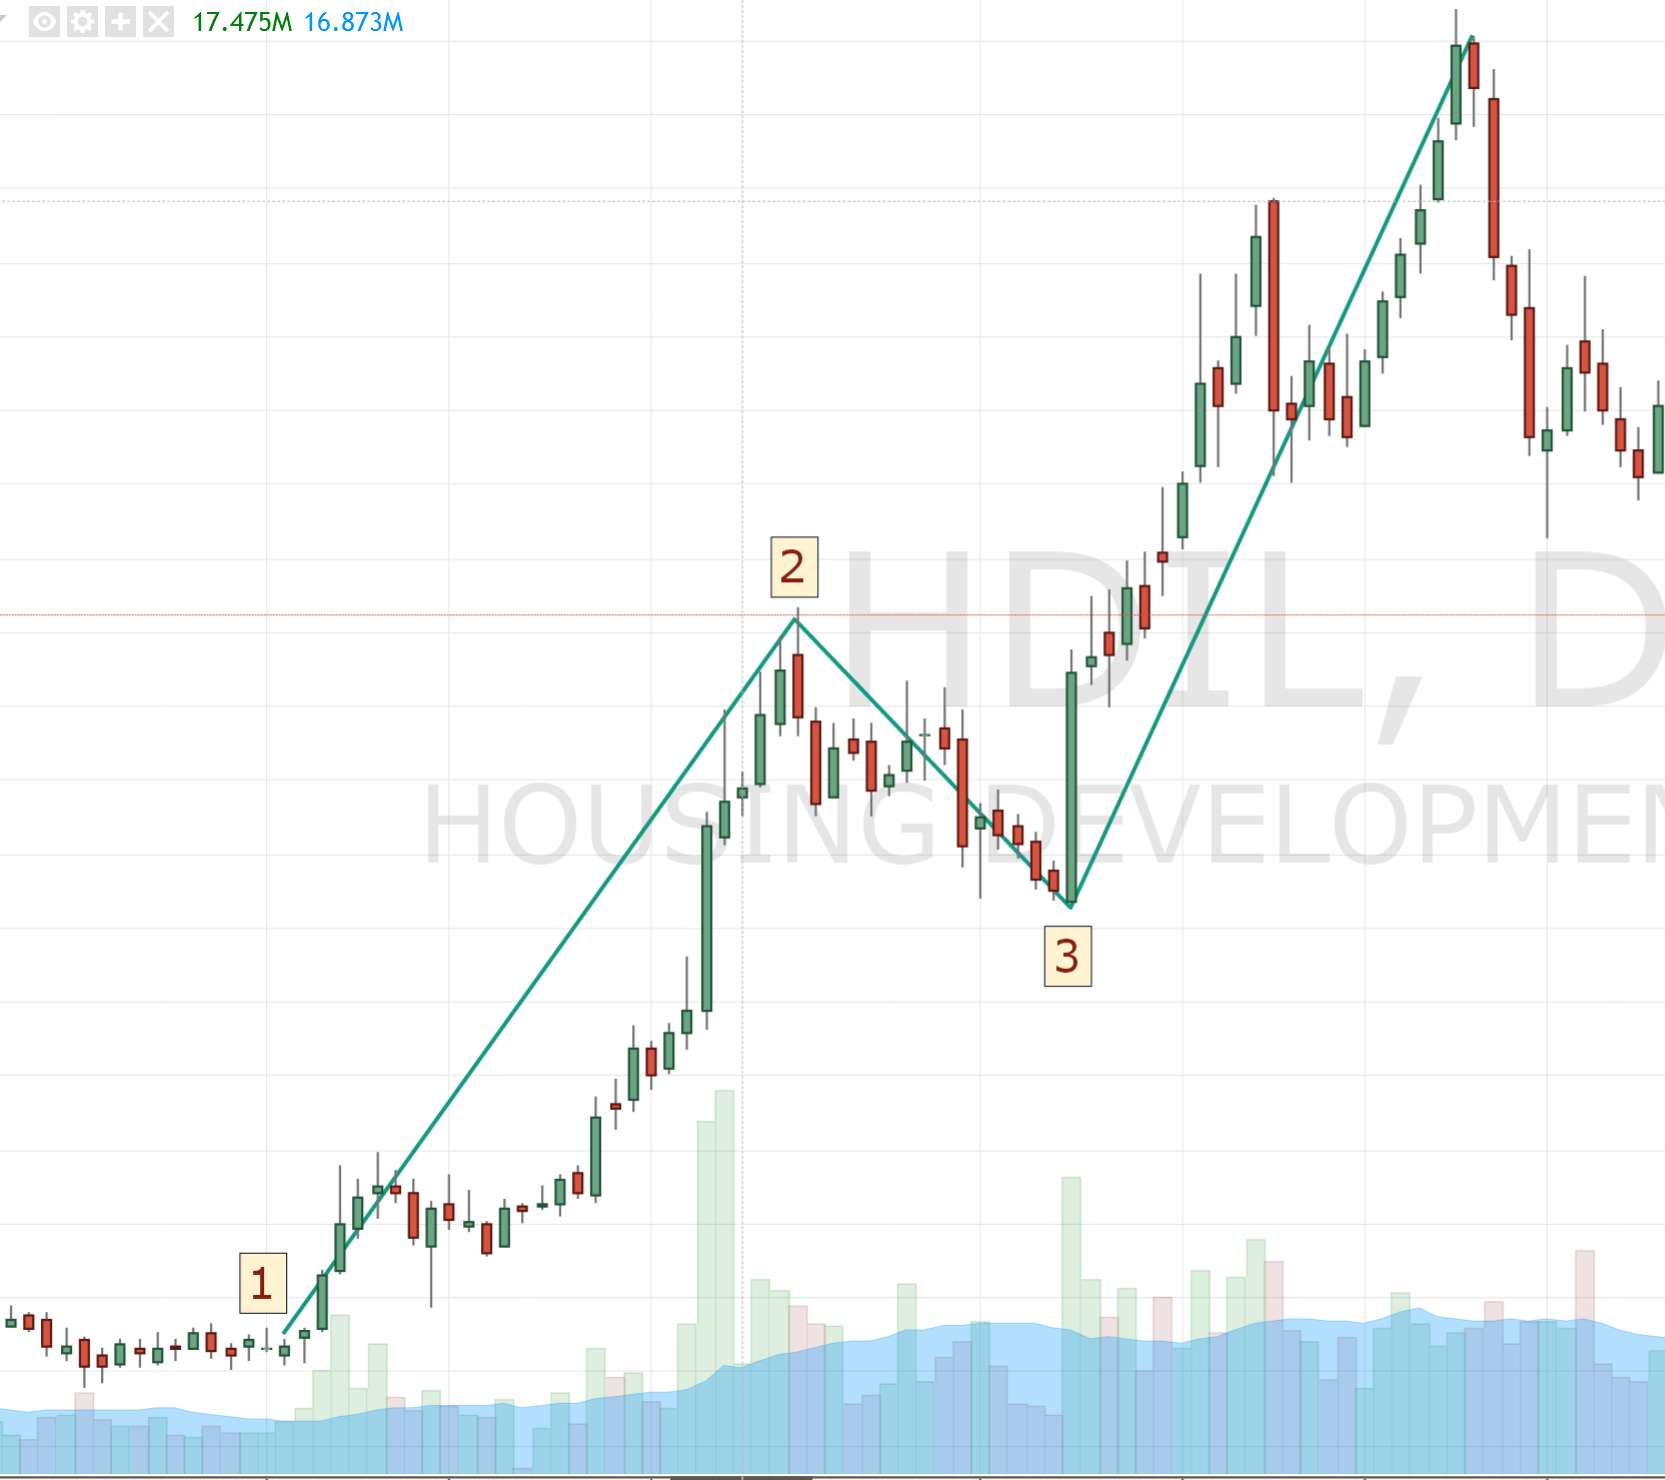
Real-Life Examples
Below is the HDIL chart, clearly illustrating how the stock entered an uptrend after a minor pullback. Points 1, 2, and 3 are highlighted in the chart:
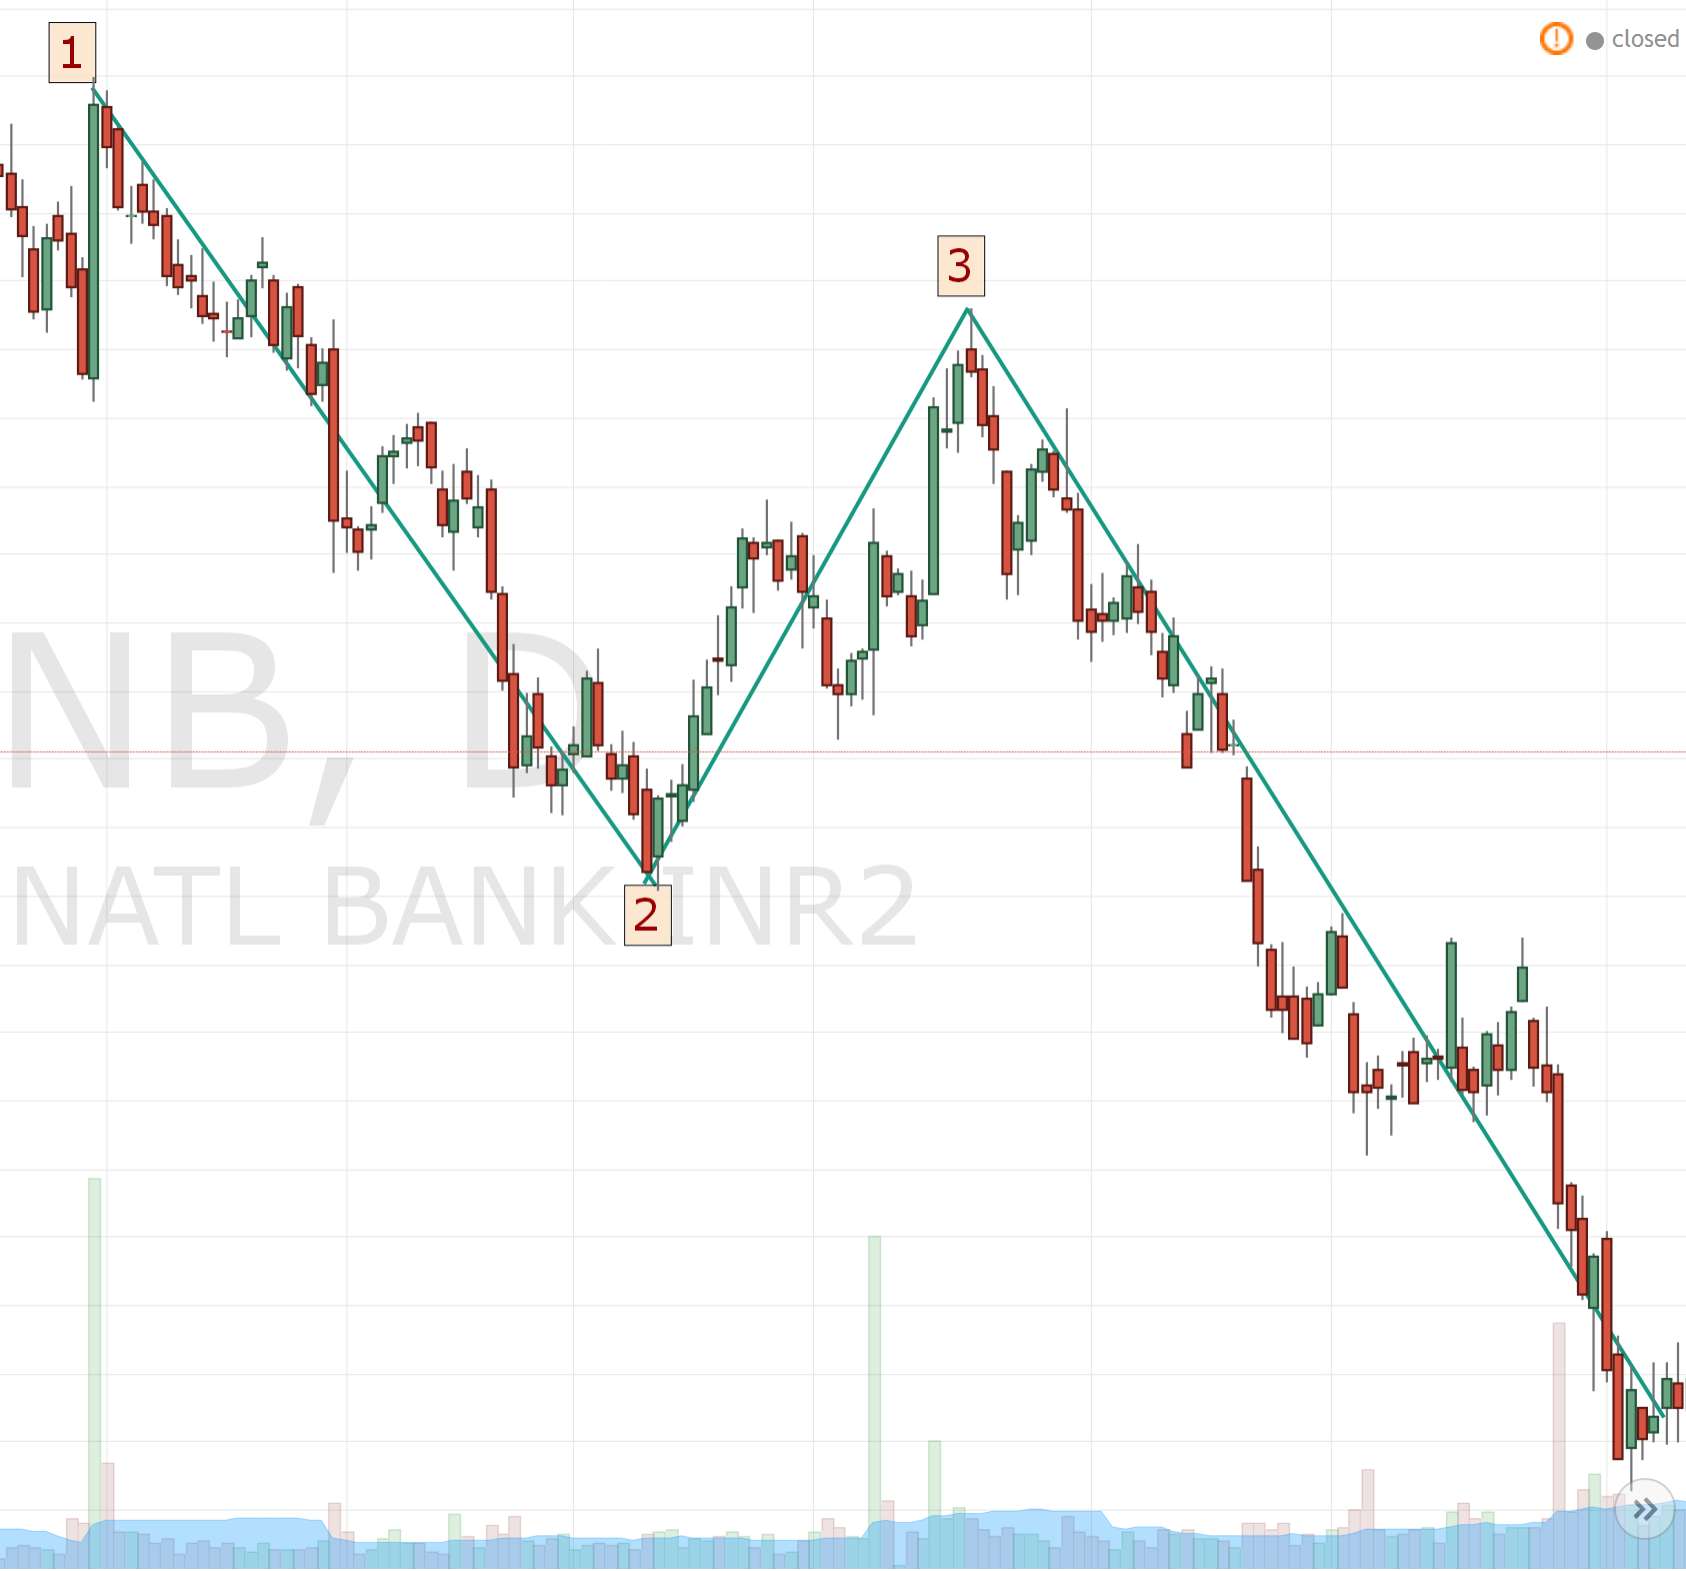
Similarly, the chart for PNB demonstrates a bearish 123 formation:
The 123 pattern is easily identifiable in charts across all timeframes. Always consider other confirmation factors when identifying potential trades based on this pattern. Feel free to ask any questions in the comments section regarding this 123 trading strategy.
Explore our website’s popular sections through these links:


2 Comments