
Imagine being on a deserted island with just a laptop and one software choice – my bet would be on “Excel.” Why? Because Excel’s versatility ranges from basic arithmetic to complex time-series analysis, perfect for stock market analysis.
Begin Your Excel Journey
First things first, get Excel on your machine. Microsoft Excel is a top choice but comes with a cost. Don’t worry, OpenOffice Calc and Google Sheets are excellent free alternatives.
Once installed, take a moment to get acquainted with Excel’s graphical user interface (GUI).
Need a crash course? This YouTube playlist is a great starting point to master Excel basics:
Experienced users can jump right into the next steps.
Inputting Stock Data into Excel
Gearing up for stock market analysis? You’ll need the essential stock data – price and volume.
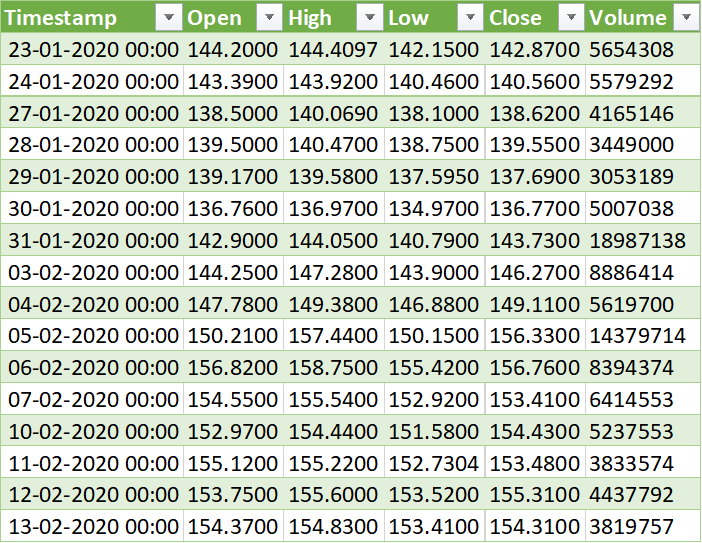
Here’s how to get this data into Excel:
- Manually: Copy and paste data from stock exchange websites into Excel. Make sure it’s well-organized.
- Automatically: For a more hands-off approach, use APIs or macro tools. Learn more with this guide.
Unleashing Excel’s Power for Stock Analysis
Excel spreadsheets are a powerhouse for stock market analysis. Once your data is in, unleash Excel’s potential with its formulae to gain valuable market insights.
For example, calculate the highest price over a period or determine a moving average. Excel’s capabilities are only limited by your imagination.
Deepen your Excel skills with these hands-on articles:
- Mastering CAGR Calculation in Excel
- Unlocking XIRR Calculation in Excel
- Creating Candlestick Charts in Excel
- Calculating Drawdown in Excel
- Setting Stop Loss in Excel
- Forecasting with Excel’s Expectancy Calculation
- Analyzing SIP Returns in Excel
Excel and Algorithmic Trading
Algorithmic trading is all about letting a computer execute trades based on predefined rules. Excel is surprisingly suitable for this, given its flexibility.
With Excel, you can:
- Link up with real-time data sources for updated stock information.
- Manipulate this data using formulas and macros.
- Test out trading strategies through backtesting.
- Create detailed profit and loss reports and performance charts.
- Seamlessly connect with broker terminals for order placement.
Excel covers all the bases of modern algorithmic trading software.
Learn more about Excel’s trading capabilities in our blog posts here.
Your Next Steps in Excel for Stock Market Analysis
Ready to become a pro in stock market analysis using Excel? Here’s what you should do next:
- Get to grips with Excel’s basics and familiarize yourself with key formulas.
- Dive into advanced features like macros and power queries.
- Build your trading rules using Excel’s capabilities.
- Test these rules against historical data.
- Create insightful graphs and analyses from your findings.