Divergences stand out as one of the most dependable trading concepts, offering excellent buy and sell opportunities. While rooted in classical technical analysis, modern hedge fund trading systems frequently incorporate them. In simple terms, divergences occur when the price and momentum move in different directions. For example, when the price rises while momentum falls, or vice versa. Various momentum-based indicators are available to identify divergences. In this post, we’ll delve into an RSI Divergence Trading System. This system boasts a high success rate, thanks to Brad Konia, who shared it on WiseStockTrader. We’ve added Buy/Sell signals and made it suitable for backtesting.
Click here to learn about AFL coding and create your own trading systems.
Understanding RSI Divergence
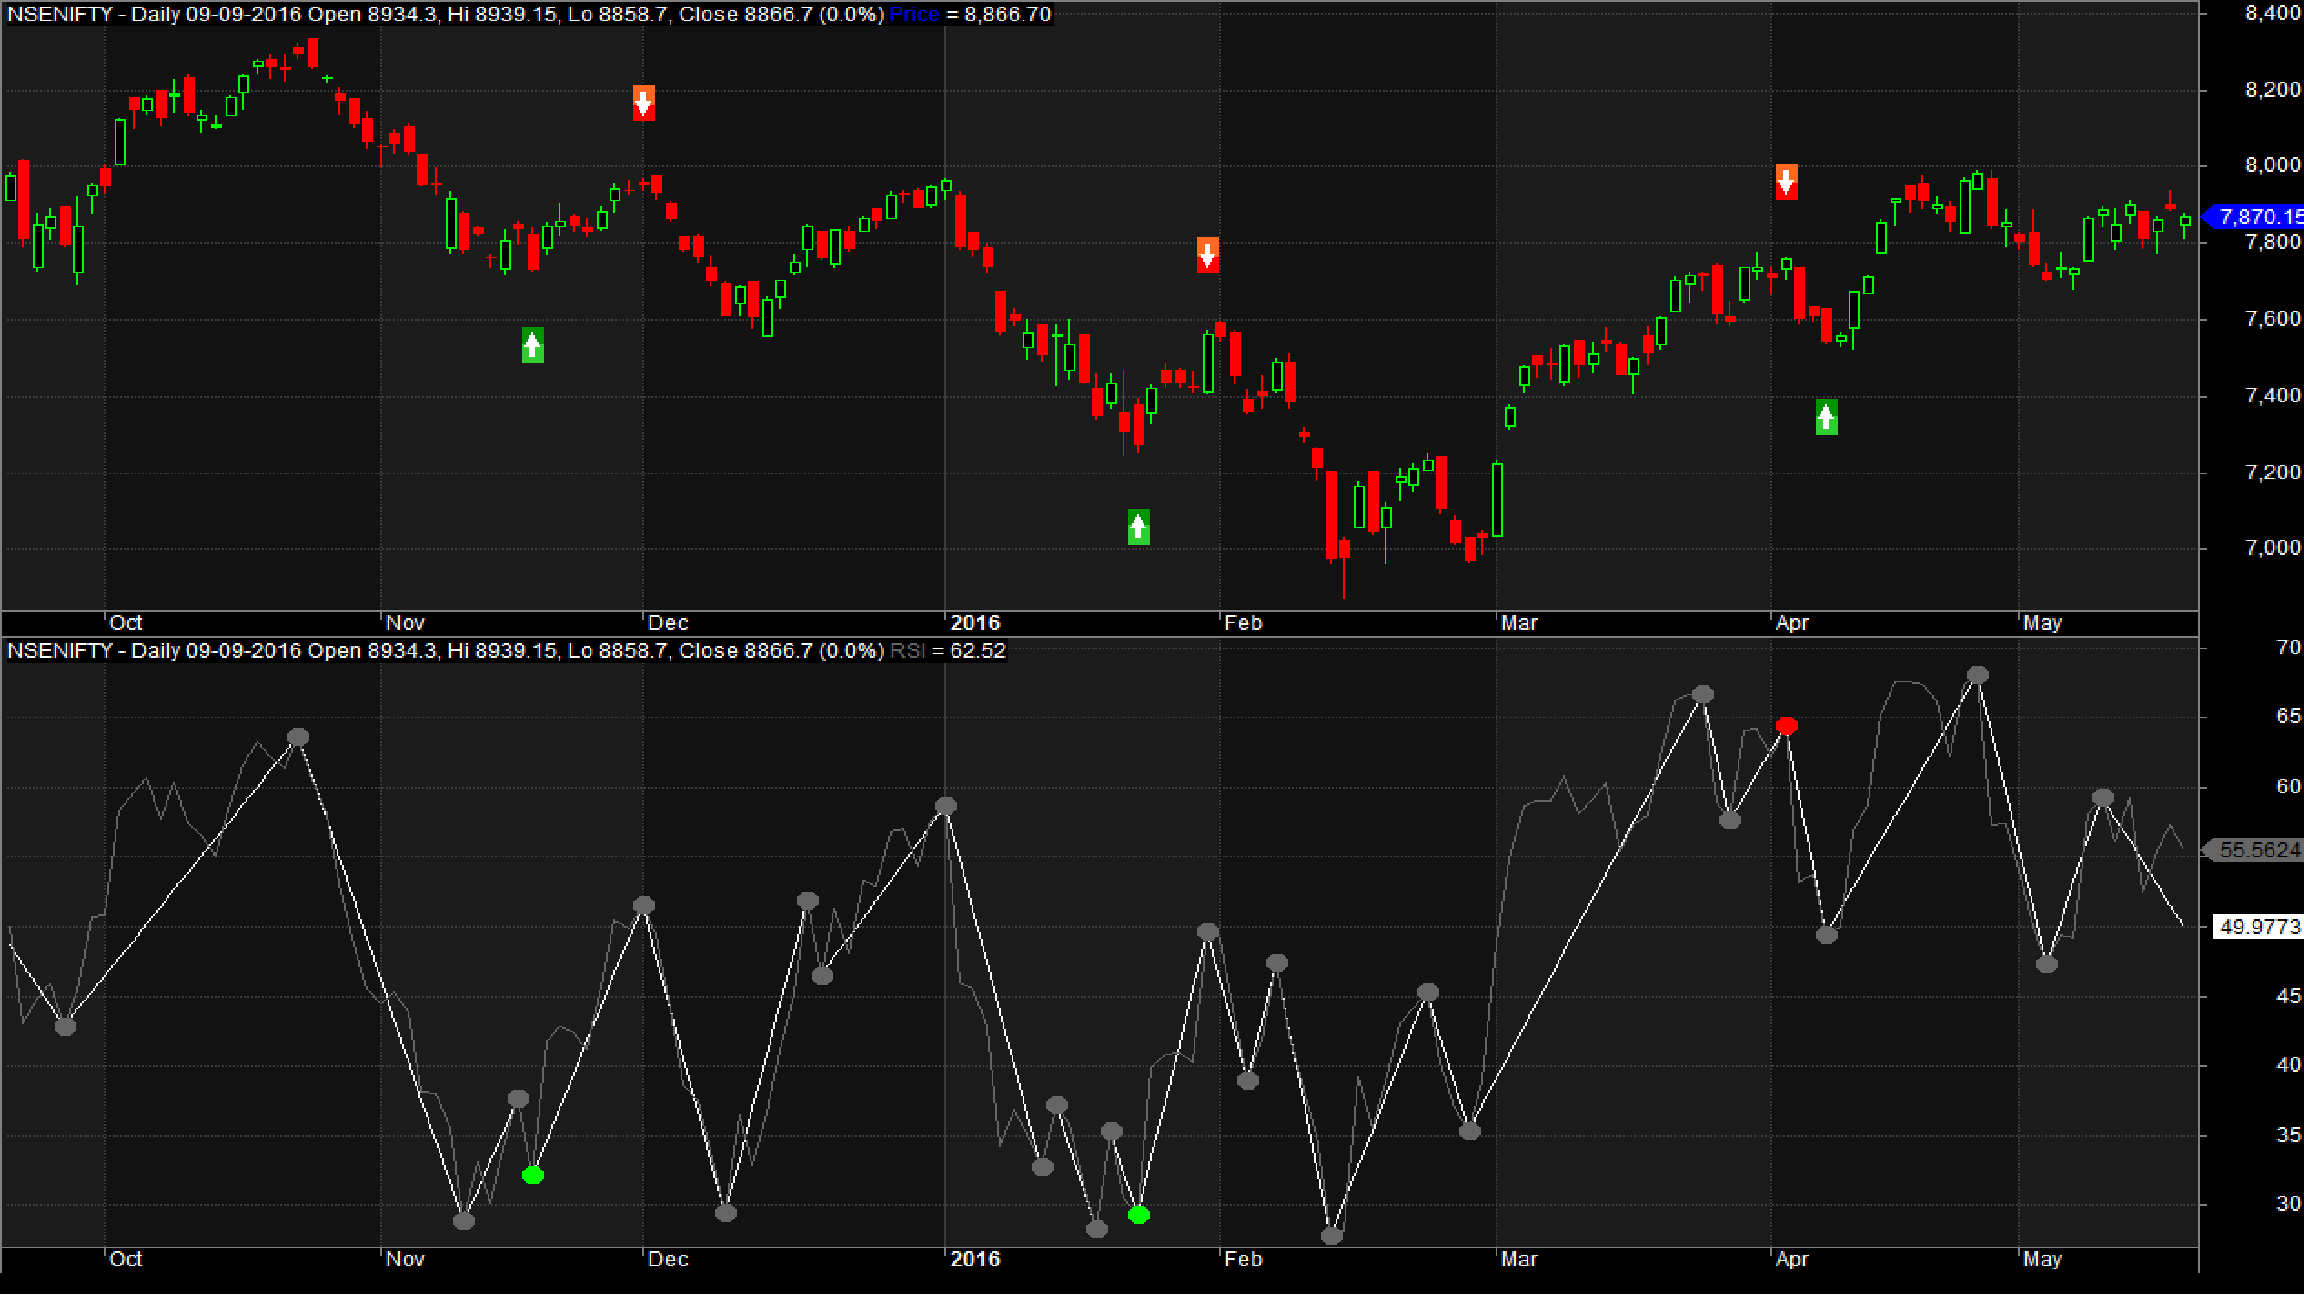
RSI Divergence occurs when the price and RSI (Relative Strength Index) do not move in the same direction. When the price climbs while RSI falls, it’s called Bearish RSI Divergence. Conversely, when the price drops while RSI rises, it’s known as Bullish RSI Divergence. The image below illustrates this concept:
The next section provides an overview of the Amibroker AFL code for the RSI Divergence Trading System. This system exhibits remarkable profit potential, with a 100% success rate for NSE Nifty in a 16-year backtest. It also performs exceptionally well with other securities.
AFL Code Overview
| Parameter | Value |
| Preferred Time-frame | Daily |
| Indicators Used | RSI(14) |
| Buy Condition | RSI Bullish Divergence |
| Short Condition | RSI Bearish Divergence |
| Sell Condition | New peak formation in RSI chart |
| Cover Condition | New trough formation in RSI chart |
| Stop Loss | No fixed stop-loss |
| Targets | No fixed targets |
| Position Size | 150 (fixed) |
| Initial Equity | 200000 |
| Brokerage | 100 per order |
| Margin | 10% |
Important Note
Note: This AFL uses the Zig Zag indicator, which can sometimes appear to predict the future. While it’s suitable for backtesting, we do not recommend using the buy/sell signals for live trading.
RSI Divergence Trading System: Screenshot
| Parameter | Value |
| Fixed Position Size | |
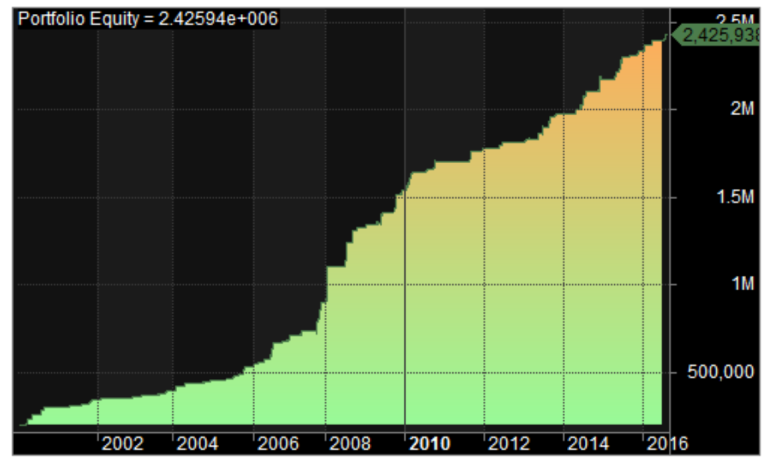
| Initial Capital | 200000 |
| Final Capital | 2425937 |
| Scrip Name | NSE Nifty |
| Backtest Period | 08-Mar-2000 to 11-Aug-2016 |
| Timeframe | Daily |
| Net Profit % | 1112.97% |
| Annual Return % | 16.12% |
| Number of Trades | 88 |
| Winning Trade % | 100% |
| Average Holding Period | 7.09 periods |
| Max Consecutive Losses | 0 |
| Max System % Drawdown | -4.83% |
| Max Trade % Drawdown | -37.3% |
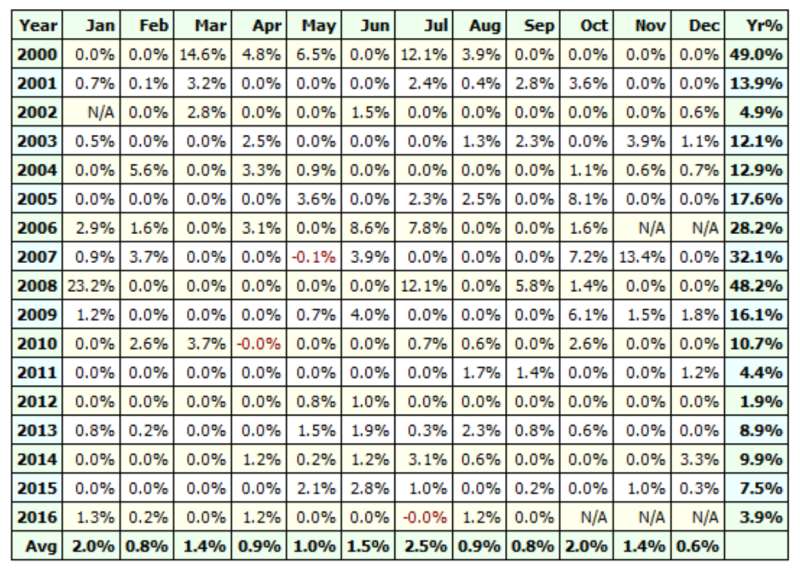
The annual return can increase significantly with compounding. Download the detailed backtest report here.
Equity Curve
Additional Amibroker Settings for Backtesting
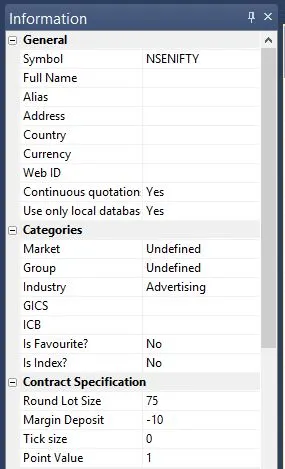
Go to Symbol → Information and specify the lot size and margin requirement. The screenshot below shows a lot size of 75 and a margin requirement of 10% for NSE Nifty:
Check out our other profitable trading systems in the links below: