
Understanding the “Range Breakout Amibroker Exploration” is crucial for traders looking to make informed decisions in the stock market. This method is a top choice for entering trades, as it signals strong momentum and active market participation when a breakout occurs. We’re going to walk you through an Amibroker exploration that pinpoints the exact price points for placing buy and sell orders and provides clear stop loss and target levels for both.

Did you know? We’ve also created an Excel version of this strategy. Discover it here.

Exploring Range Breakout in Amibroker: What You Need to Know

This exploration uses the average 5-day range of a stock or instrument. In the intraday timeframe, if the price breaks above or below this range, it’s your cue to take action.

This strategy is all about intraday trading. It gives you the buy/sell levels right at the market opening. The goal? Trade according to these levels and wrap up all your positions by the end of the day.

Here’s a sneak peek at some essential columns from this exploration:

  • Buy Above: The price at which you should consider a Buy order.
  • Sell Below: The price at which a Sell (Short) order becomes a good idea.
  • Buy SL: Your stop loss level for a Buy position.
  • Sell SL: Your stop loss level for a Sell position.
  • Buy Target (1,2,3): The three progressive targets for a Buy position.
  • Sell Target (1,2,3): The three target levels for a Sell position.

Get the Range Breakout Exploration for Amibroker

				
					//------------------------------------------------------
//
//  Formula Name:    Range Breakout Exploration
//  Website:         https://zerobrokerageclub.com/
//------------------------------------------------------

_SECTION_BEGIN("Range Breakout Exploration");

SetChartOptions(0,chartShowArrows|chartShowDates);

Plot( Close, "Price", colorWhite, styleCandle );

Filter = Close > 0;

AddColumn(Open,"Open");
AddColumn(High,"High");
AddColumn(Low,"Low");
AddColumn(Close,"Close");

range = Min(H-O,O-L);
AddColumn(range,"Day's Range");

Avg5DayRange = MA(Ref(range,-1),5);
AddColumn(Avg5DayRange,"Average 5 Day's Range");

BuyAbove = O+Avg5DayRange;
SellBelow = O-Avg5DayRange;

AddColumn(BuyAbove,"Buy Above");
AddColumn(SellBelow,"Sell Below");
AddColumn(SellBelow,"Buy SL");
AddColumn(BuyAbove,"Sell SL");

BuyTGT1 = BuyAbove + Avg5DayRange;
BuyTGT2 = BuyTGT1 + Avg5DayRange;
BuyTGT3 = BuyTGT2 + Avg5DayRange;

SellTGT1 = SellBelow - Avg5DayRange;
SellTGT2 = SellTGT1 - Avg5DayRange;
SellTGT3 = SellTGT2	 - Avg5DayRange;

AddColumn(BuyTGT1,"BuyTGT1");
AddColumn(BuyTGT2,"BuyTGT2");
AddColumn(BuyTGT3,"BuyTGT3");

AddColumn(SellTGT1,"SellTGT1");
AddColumn(SellTGT2,"SellTGT2");
AddColumn(SellTGT3,"SellTGT3");

SetSortColumns( -2 ); 

_SECTION_END();


Tested and functional on Amibroker version 6 and newer. Don’t have Amibroker yet? Grab the trial version here.

Implementing the Range Breakout Exploration Code

Step 1: Open Amibroker, go to File–>New–>Formula, and paste the exploration code.

Step 2: Navigate to File–>New–>Analysis and set the time frame to Daily.

Step 3: Select ‘All symbols’ or your chosen stock list in the “Apply to” section. For the range, opt for ‘1 recent day(s)’. Then, load the AFL code in the “Formula” box.

Exploration-settingsStep 4: Hit the Explore button to see stocks with their buy/sell levels and targets.

Exploration-Results

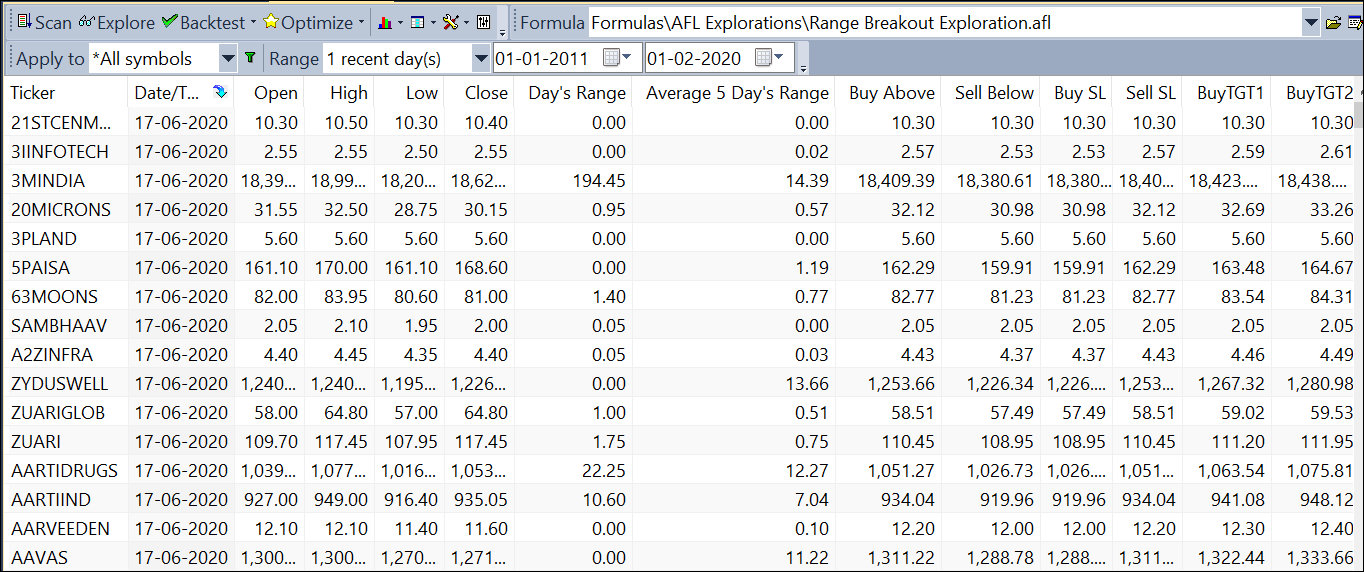
Note: This exploration requires real-time data, as the levels depend on the current day’s opening price.

Also Read: A Simple Multi Timeframe Trading Strategy with Exploration AFL

Deciphering the Range Breakout Exploration Code

The code is intuitively simple, calculating the day’s range and the average 5-day range with these formulas:

Range-Breakout-Amibroker-Exploration

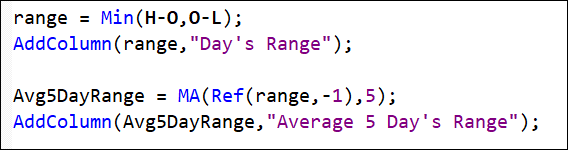
The day’s range is determined by finding the smaller of two values: the gap between the High and Open prices, and that between the Open and Low prices.

Then, the AddColumn() function incorporates these values into your exploration results.

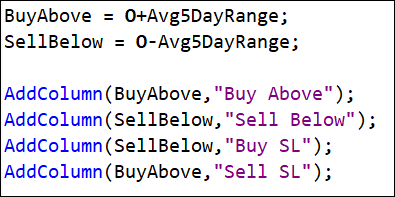
Next, it calculates the BuyAbove and SellBelow thresholds, indicating where to initiate your trades.

For stop losses, set the Buy stop loss (BuySL) to match SellBelow, and the Sell stop loss (SellSL) to align with BuyAbove.

Range-Breakout-Amibroker-Exploration

The rule is straightforward: if the Current Market Price (CMP) exceeds the sum of the open price plus the average 5-day range, it’s time to place a BUY order.

On the flip side, place a SELL order if the CMP dips below the open price minus the average 5-day range.

The exploration also efficiently calculates buy and sell targets, adding them to your results.

Range-Breakout-Amibroker-Exploration

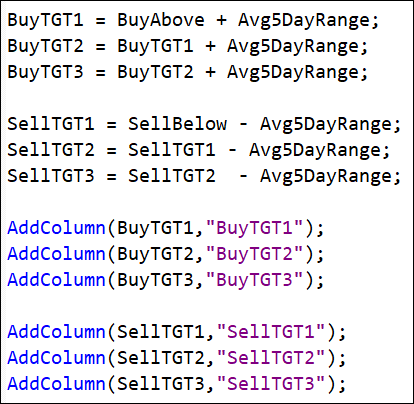
Each Buy target is the sum of the Buy price and the average 5-day range, with subsequent targets building on the previous one. While this example shows three targets, you can expand upon this logic to add more. The same approach is used for setting Sell targets.

One Comment

Leave a Reply