

Guide to Calculate Drawdown in Excel for Trading Systems
Understanding drawdown is vital for evaluating trading systems. This measure, indicating the peak-to-trough decline in equity value, can be calculated efficiently in Excel. This post will guide you through the process, adding value for beginners even though most backtesting tools already provide this metric.
Related Read: Plotting a Candlestick Chart in Excel
What Is a Drawdown?
Drawdown, usually measured in percentage terms, indicates how much your equity has fallen from its highest point. For instance, if you buy a stock at $100 and it rises to $120 before falling back to $110, that’s a $10 or 8.3% drawdown from its peak.
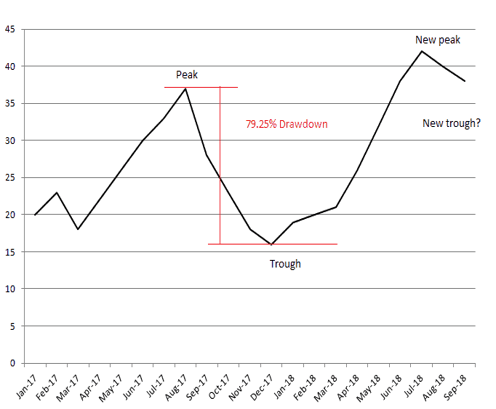
Drawdowns are inevitable in any trading system. The focus, however, should be on minimizing these declines, which we’ll address in a future post.
Steps to Calculate Drawdown in Excel
Calculating drawdown in Excel is straightforward. Here’s how you can do it:
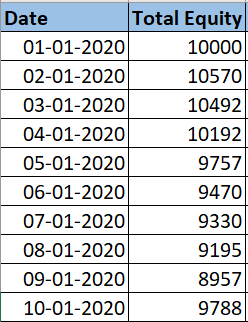
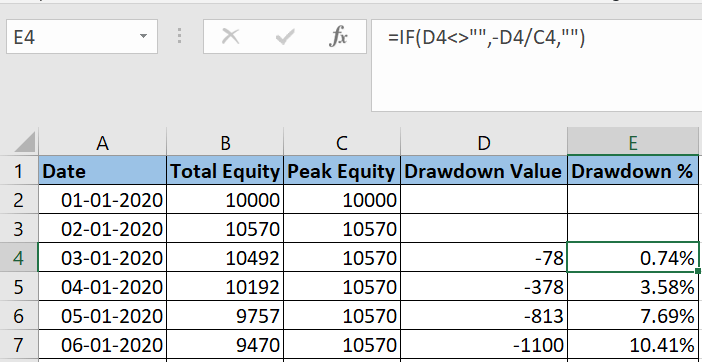
Start by listing your total equity in chronological order. Place this data in Excel columns A and B.
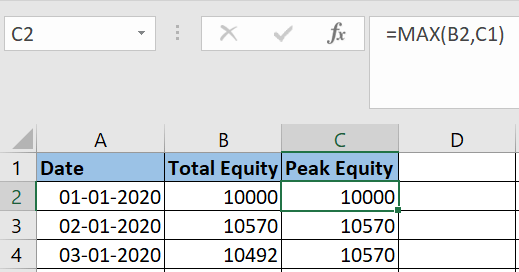
In column C, calculate your ‘Peak Equity’ as the maximum of current and previous peak equity values.
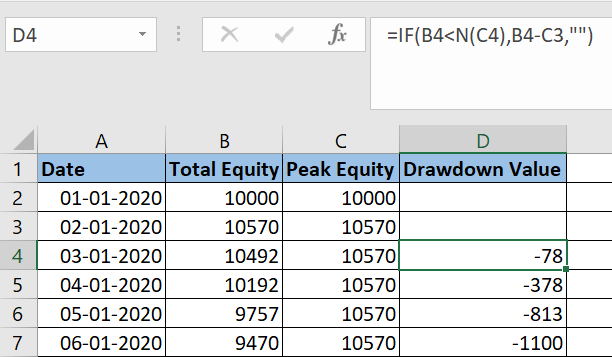
Column D will show the drawdown amount, the difference between current and peak equity.
Column E will display the Drawdown %, which is the drawdown relative to peak equity.
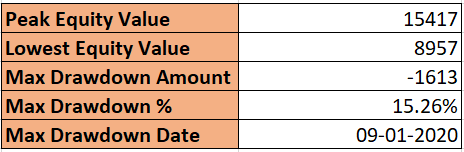
After completing these calculations, summarize the final statistics using Excel’s min/max functions. For guidance, refer to the sample Excel sheet provided.
For Advanced Learning: Mastering Backtesting Trading Strategies
Download the Excel Template for Drawdown Calculation
Access the Excel template to calculate drawdowns efficiently. Download it using the link below:


4 Comments