

Unlocking the Power of SIPs
Nowadays, savvy investors are flocking towards a systematic investment plan (SIP) for injecting funds into the market at regular intervals. This strategy is a clever way to balance your investments across various market stages, typically resulting in significant returns over time. Whether it’s in mutual funds or stocks, SIPs are gaining ground, especially among mutual fund enthusiasts. This guide aims to demystify the process of calculating SIP returns using Excel.
Recommended Reading: Excel Mastery: Calculating Expectancy
Mastering SIP Returns with Excel’s FV Function
Excel’s Magic Tool for SIP Returns: The FV (Final Value) function in Microsoft Excel is a ready-to-use feature for computing the growth of your investments. It’s an efficient tool for investors looking to calculate SIP returns.
This function operates with five parameters, where three are crucial.
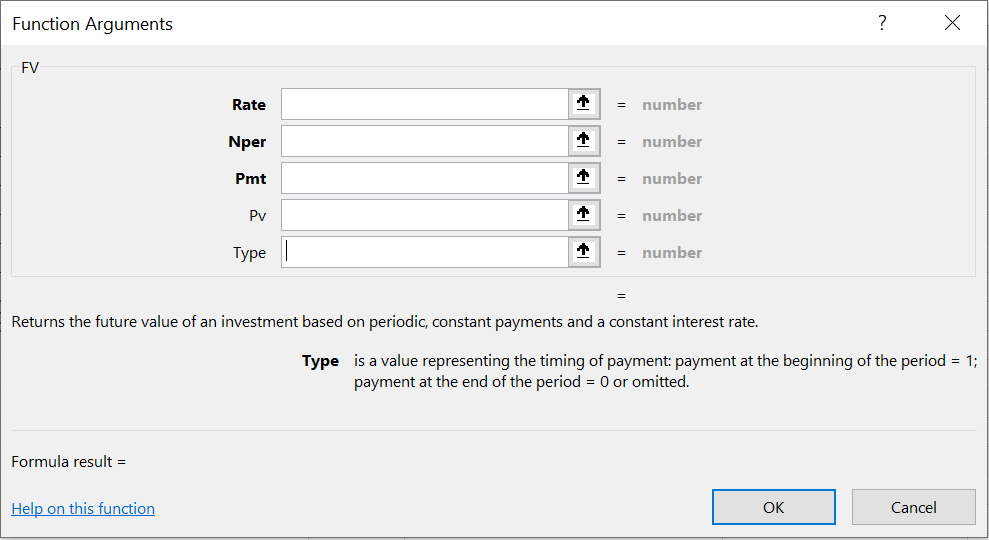
- Rate: This parameter is your expected return rate for a given period. For instance, a 15% annual return on your mutual fund SIP equates to a monthly rate of 1.25% (15/12).
- Nper: This represents the total number of investment periods. If you’re investing monthly over 5 years, your Nper is 60 months (5*12).
- Pmt: Known as the SIP amount, this is the investment per period. It appears as a negative number, showing the outflow of funds.
- Pv: The initial amount invested before the SIP kicks off, typically zero.
- Type: This defines the timing of investments within each period. ‘1’ indicates the start, and ‘0’ the end.
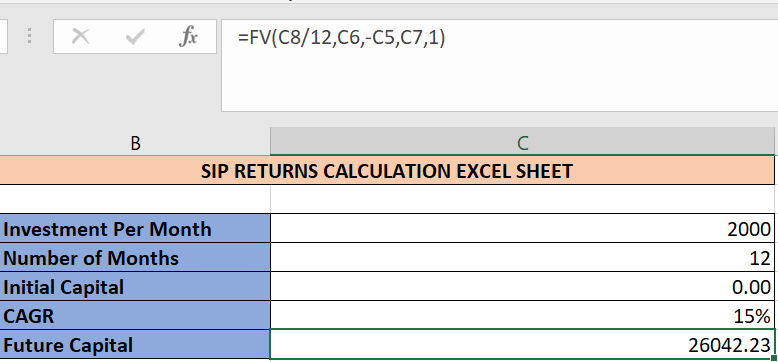
Explore how this function is applied in Excel to calculate the ultimate balance for a SIP investment, assuming a 15% annual return.
This function is a user-friendly solution, removing complexities from the calculation process.
Manual Approach to Calculating SIP Returns
A Closer Look at Your Investment: The FV function, while efficient, doesn’t show the growth of your investment each month. Therefore, we offer an alternative method to manually calculate SIP returns, granting you a detailed view of monthly gains.
This method lets you track the progress of your investment month-by-month.
Here’s a glimpse at the process:
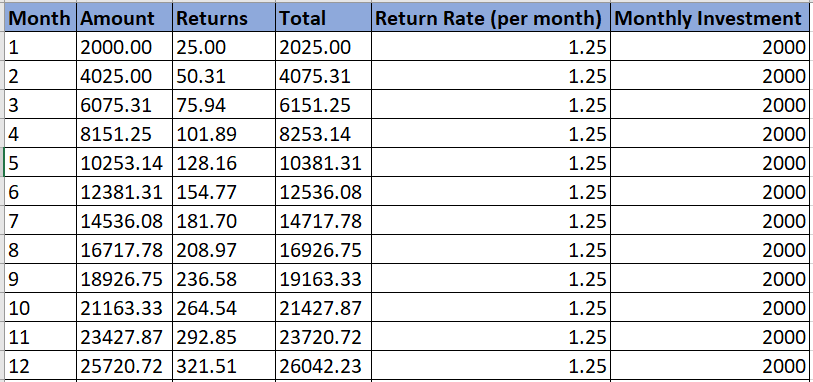
Note that the final sum remains consistent between both methods, amounting to 26042.23.
The monthly return rate gets derived by dividing the expected CAGR by 12. The returns column vividly shows the expected ROI for each month.
Feel free to tweak ‘Monthly Investment’ and ‘Return Rate’ to simulate different scenarios.
Further Insight: Calculating CAGR in Excel: A Step-by-Step Guide
Download the SIP Returns Excel Template
Get Started on Your Own: Download the Excel template for SIP returns calculation from the link below to start your journey in mastering SIP returns calculation:


2 Comments