In this guide, we’ll explore the Balance of Power Indicator Amibroker AFL Code, a handy tool for stock market enthusiasts. This code is free to download and can be seamlessly integrated into Amibroker.

Getting to Know the Balance of Power Indicator

The Balance of Power is an insightful technical indicator that helps you gauge who’s ruling the market – buyers or sellers. It does this by measuring the buying strength in uptrends and the selling force in downtrends. Here’s the simple formula it uses: BOP = (Close - Open) / (High - Low) The BOP indicator produces values between -1 and 1. Positive values suggest buyers are dominating, while negative values hint that sellers have the upper hand. Also Read: Weekly Breakout Trading Strategy Amibroker AFL Code

The Balance of Power Indicator AFL

				
					//------------------------------------------------------
//
//  Formula Name:    Balance of Power Indicator
//  Website:         https://zerobrokerageclub.com/
//------------------------------------------------------

_SECTION_BEGIN("Balance of Power Indicator");

SetChartOptions(0,chartShowArrows|chartShowDates);
_N(Title = StrFormat("{{NAME}} – {{INTERVAL}} {{DATE}} Open %g, Hi %g, Lo %g, Close %g (%.1f%%) {{VALUES}}", O, H, L, C, SelectedValue( ROC( C, 1 ) ) ));

Plot( Close, "Price", colorWhite, styleCandle );

// Calculation of Balance of Power Indicator
BOP = (C - O) / (H - L);

// Plotting the Indicator
Plot(BOP, "Balance of Power", colorBlue, styleHistogram|styleOwnScale );


_SECTION_END();


See the BoP Indicator in Action

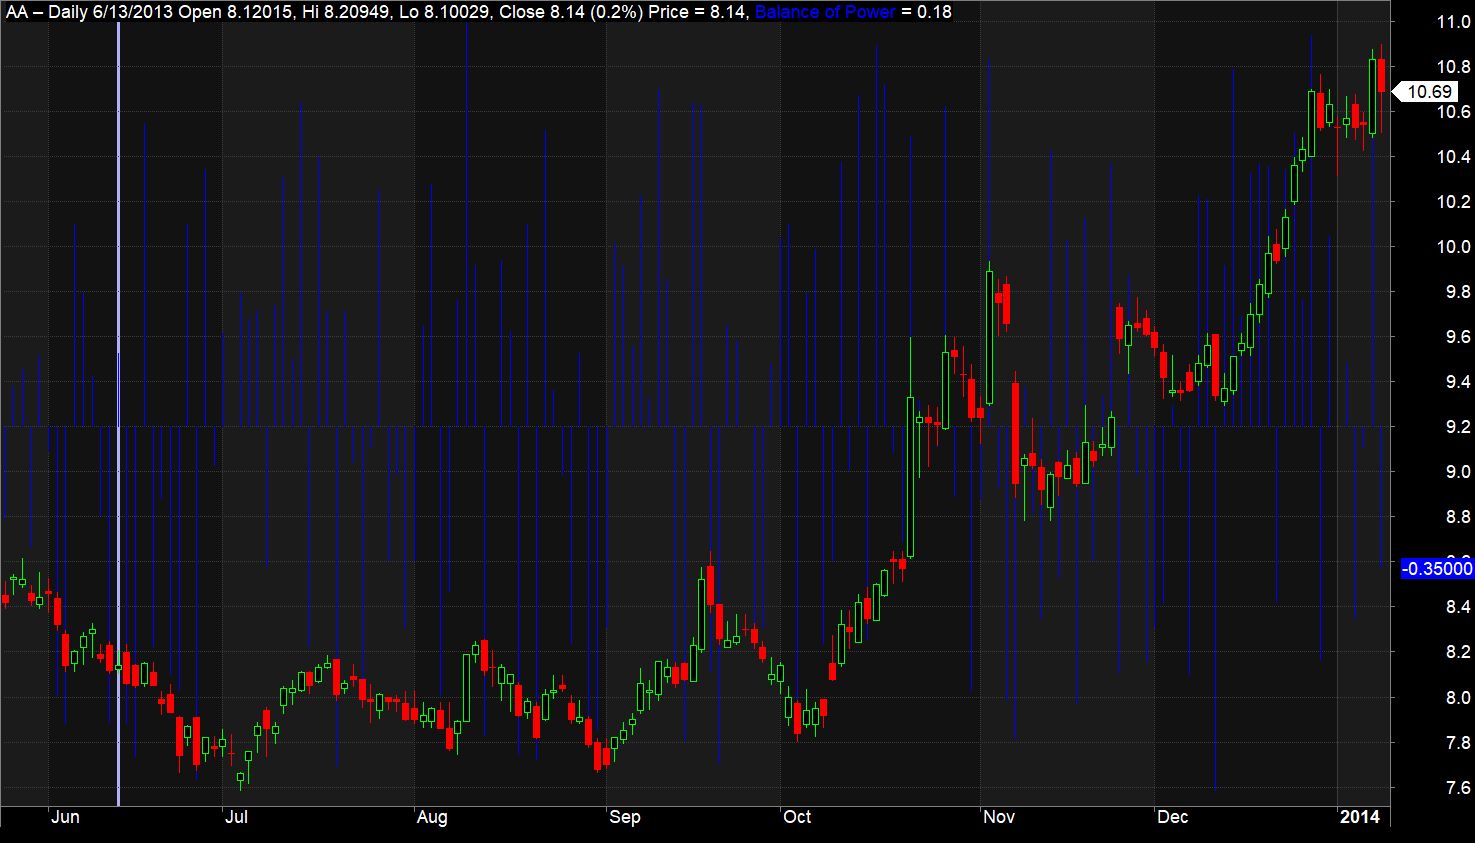
Here’s what the BoP Indicator looks like in Amibroker:

Balance-of-Power-Indicator-Amibroker-AFL

Understanding the AFL Code

  • The code kicks off with the BOP calculation formula: (Close - Open) / (High - Low).
  • It begins by figuring out the BOP indicator using this formula. BOP is stored as a variable, with C and O representing the current closing and opening prices, and H and L denoting the high and low prices of the current bar.
  • The Plot() function brings the BOP indicator to life on your screen as a histogram. The parameters include the BOP data, the plot name (“Balance of Power”), a blue color scheme, and the histogram style.

Also Read: The 7 Best Indicators for Intraday Trading

Leave a Reply