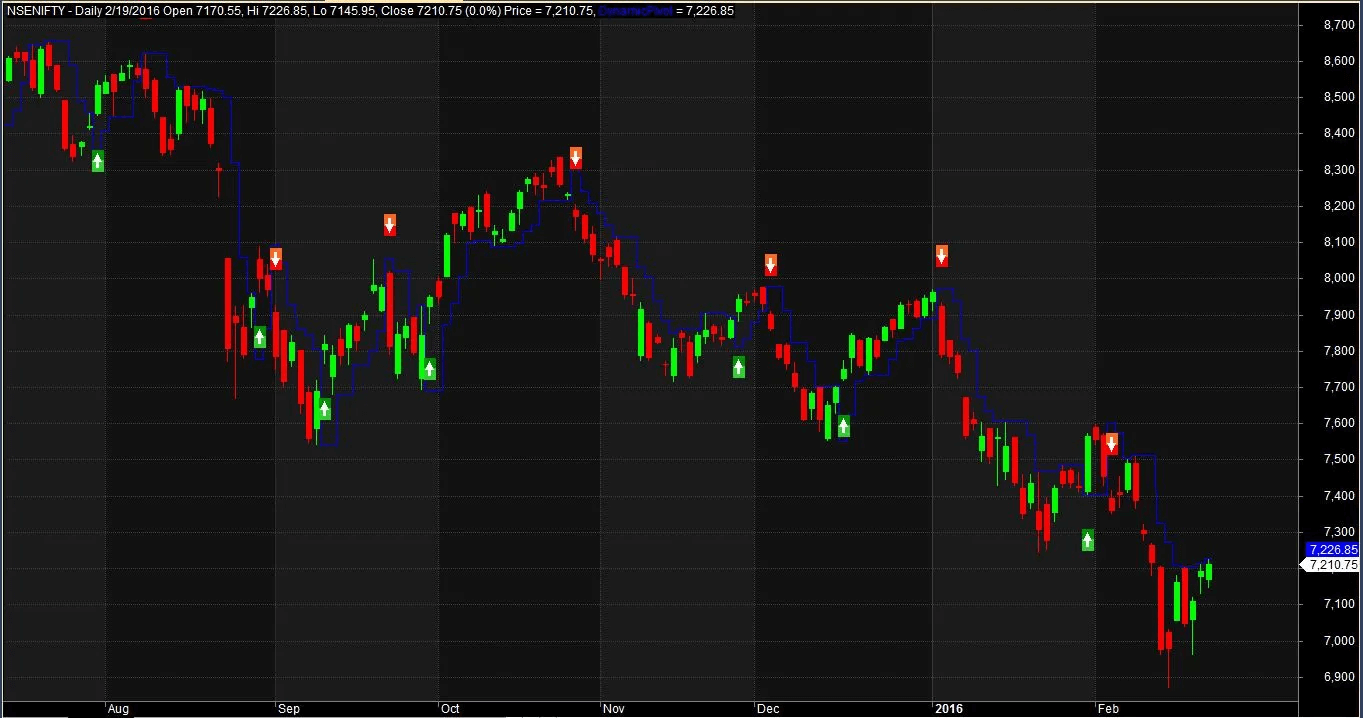
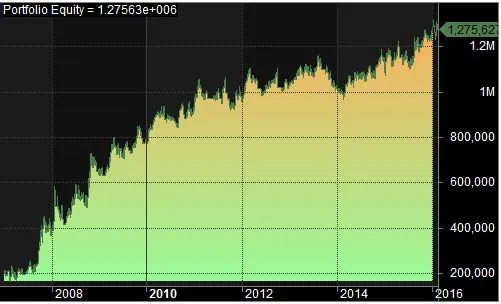
This strategy is designed around a breakout approach, generating buy/sell signals when the price crosses dynamic support/resistance levels. Support/resistance calculations rely on the highest high and lowest low values over a specified lookback period. This strategy performs well in trending markets.
For more on AFL coding and creating your own trading systems, visit this!
- Preferred Timeframe: Daily, Hourly
- Indicators Used: None
- Buy Condition: Price crosses above dynamic resistance.
- Sell Condition: Price crosses below dynamic support.
- Stop Loss: 2%
- Targets: No fixed target, Stop and reverse when AFL gives the opposite signal
- Position Size: 150 (fixed)
- Initial Equity: 200,000
- Brokerage: ₹50 per order
- Margin: 10%
AFL Code
					//------------------------------------------------------
//  Formula Name:    Support Resistance based Trading System
//  Website:         zerobrokerageclub.com
//-------------------

_SECTION_BEGIN("Dynamic Support Resistance");

SetTradeDelays( 1, 1, 1, 1 );
SetOption( "InitialEquity", 200000);
SetOption("FuturesMode" ,True);
SetOption("MinShares",1);
SetOption("CommissionMode",2);
SetOption("CommissionAmount",50);
SetOption("AccountMargin",10);
SetOption("RefreshWhenCompleted",True);
SetPositionSize(150,spsShares);
SetOption( "AllowPositionShrinking", True );
BuyPrice=Open;
SellPrice=Open;
ShortPrice=Open;
CoverPrice=Open;

SetChartOptions(0,chartShowArrows|chartShowDates);
_N(Title = StrFormat("{{NAME}} – {{INTERVAL}} {{DATE}} Open %g, Hi %g, Lo %g, Close %g (%.1f%%) {{VALUES}}", O, H, L, C, SelectedValue( ROC( C, 1 ) ) ));


Plot( Close, "Price", colorWhite, styleCandle );

period=Optimize("Swing",3,1,25,1);
res=HHV(H,period); //resistance
sup=LLV(L,period); //support
DynamicPivot=IIf(ValueWhen(IIf(C>Ref(res,-1),1,IIf(C<Ref(sup,-1),-1,0))!=0,IIf(C>Ref(res,-1),1,IIf(C<Ref(sup,-1),-1,0)),1)==1,sup,res);
//If current close breaks the resistance then dynamic pivot level would be last support, if close breaks the support then dynamic pivot level will be last resistance
Plot(DynamicPivot, "DynamicPivot", colorBlue, styleStaircase);
Buy = Cross(C,DynamicPivot) ;
Sell = Cross(DynamicPivot,C)  ;
Short = Sell;
Cover = Buy;

StopLoss=2;

ApplyStop(Type=0,Mode=1,Amount=StopLoss);

/* Plot Buy and Sell Signal Arrows */
PlotShapes(IIf(Buy, shapeSquare, shapeNone),colorGreen, 0, L, Offset=-40);
PlotShapes(IIf(Buy, shapeSquare, shapeNone),colorLime, 0,L, Offset=-50);
PlotShapes(IIf(Buy, shapeUpArrow, shapeNone),colorWhite, 0,L, Offset=-45);
PlotShapes(IIf(Cover, shapeSquare, shapeNone),colorGreen, 0, L, Offset=-40);
PlotShapes(IIf(Cover, shapeSquare, shapeNone),colorLime, 0,L, Offset=-50);
PlotShapes(IIf(Cover, shapeUpArrow, shapeNone),colorWhite, 0,L, Offset=-45);
PlotShapes(IIf(Sell, shapeSquare, shapeNone),colorRed, 0, H, Offset=40);
PlotShapes(IIf(Sell, shapeSquare, shapeNone),colorOrange, 0,H, Offset=50);
PlotShapes(IIf(Sell, shapeDownArrow, shapeNone),colorWhite, 0,H, Offset=-45);
PlotShapes(IIf(Short, shapeSquare, shapeNone),colorRed, 0, H, Offset=40);
PlotShapes(IIf(Short, shapeSquare, shapeNone),colorOrange, 0,H, Offset=50);
PlotShapes(IIf(Short, shapeDownArrow, shapeNone),colorWhite, 0,H, Offset=-45);


_SECTION_END();
Read Also: Unlocking Stock Market Profits: Margin Trading Explained

| Parameter | Value |
| NSE Nifty | |
| Initial Capital | 200,000 |
| Final Capital | 1,275,626.60 |
| Backtest Period | 01-Jan-2007 to 19-02-2016 |
| Timeframe | Daily |
| Net Profit % | 537.81% |
| Annual Return % | 22.48% |
| Number of Trades | 243 |
| Winning Trade % | 41.56% |
| Average Holding Period | 8.93 periods |
| Max Consecutive Losses | 6 |
| Max System % Drawdown | -28.78% |
| Max Trade % Drawdown | -60.73% |
Download the detailed backtest report here.
Please note that you can expect even better results if you allow compounding of your returns.
Additional Amibroker settings for backtesting

Go to Symbol → Information, and specify the lot size and margin requirement. Below is a screenshot showing a lot size of 75 and a margin requirement of 10% for NSE Nifty:
Read Also: Boost Your Earnings: 10 Points Daily with NSE Nifty Investment


5 Comments