

Unlocking Essential Candlestick Patterns every Trader should know
Explore the fascinating realm of technical analysis and discover thousands of distinctive chart patterns, constantly evolving. New traders often face the challenge of comprehending this diverse landscape. To simplify your journey, we’ve curated a list of the top three dependable candlestick patterns every trader should know. These patterns are evaluated based on their historical performance and trustworthiness. Extensive testing across various charts and timeframes has shown them to be more reliable and accurate than many other price action chart patterns.
If you’re interested, you can also delve into Candlestick Patterns in Stock Analysis.
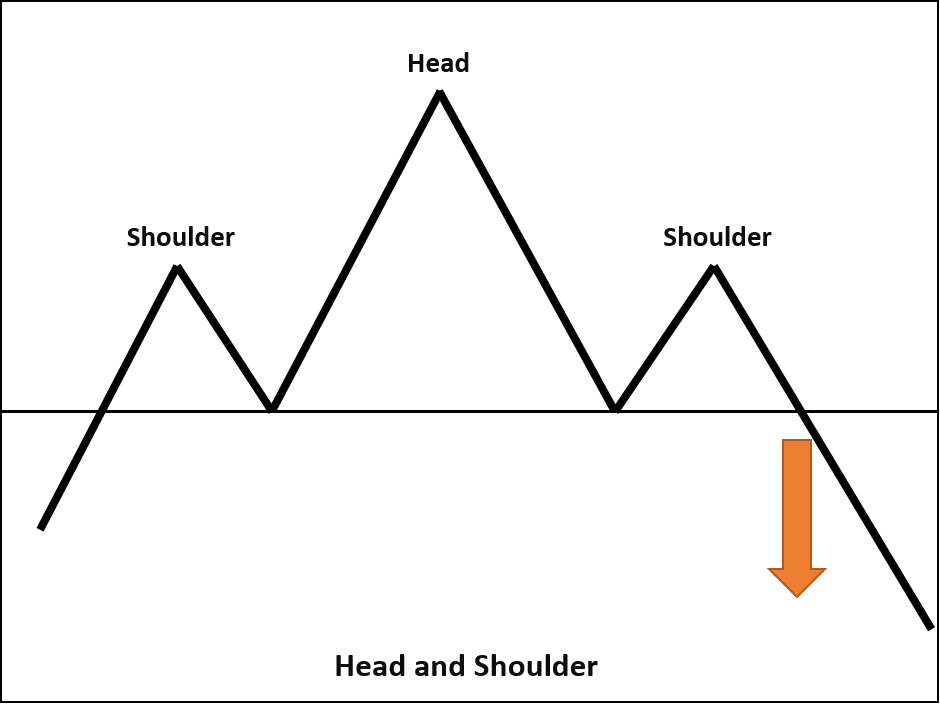
1. Head and Shoulders
The Head and Shoulders pattern stands out as one of the most accurate chart patterns we’ve encountered. Its effectiveness transcends different charts and timeframes. Our research reveals an impressive 90% accuracy rate. Committing to understanding and utilizing the Head and Shoulders pattern could lead to success in nine out of ten cases. This pattern acts as a valuable indicator of potential trend reversals.
This pattern is characterized by two almost identical peaks, with a higher peak in the center referred to as the “Head.” The matching peaks on either side are known as the “Shoulders.” The line connecting the lowest points between the two shoulders is termed the “neckline.” When the price falls below the neckline after reaching the second shoulder, it signals a bearish reversal in an ongoing uptrend. Conversely, the “Inverted Head and Shoulders” indicates a bullish reversal during a downtrend.
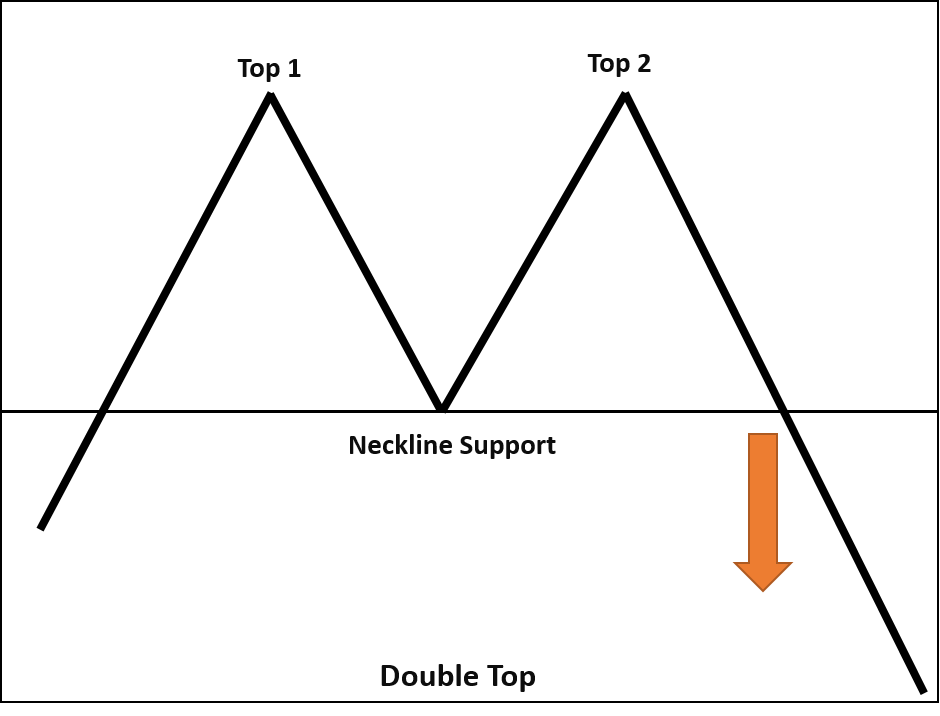
2. Double Top and Double Bottom
The Double Top and Double Bottom patterns share similarities with the Head and Shoulders but lack the “Head” component. A Double Top involves two nearly identical peaks in close proximity. Should the price fall below the prior low point between these peaks after the second peak, it signals a bearish reversal. Conversely, a Double Bottom consists of two nearly identical troughs, and a breakout above the previous high point suggests a bullish reversal.
There’s also a more complex variation known as the “Triple Top and Bottom,” which incorporates three peaks or troughs instead of two. While it offers greater accuracy, spotting it on a chart can be a challenging task.
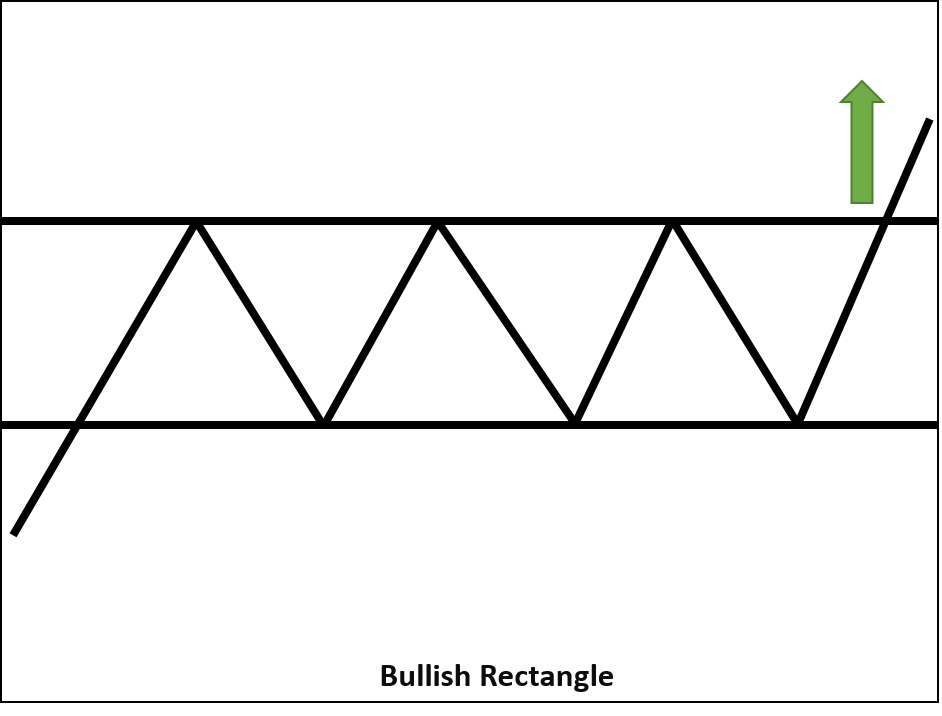
3. Bullish and Bearish Rectangle
The Rectangle pattern is easily identifiable, characterized by a visible trading range featuring multiple nearly identical highs and lows. The line connecting the highs forms a horizontal resistance line, while the line connecting the lows creates a horizontal support line. Breaking through the resistance line signifies a bullish rectangle, while breaching the support line indicates a bearish rectangle.
Take a close look at charts spanning various timeframes to identify these highly accurate chart patterns. Their consistently impressive performance may surprise you. If you believe there are other patterns that outperform these, please share your insights, and we’ll consider adding them to this article.


7 Comments