

Stop Loss Hunting: Navigating Market Manipulations
Stop Loss Hunting refers to an unfair practice where market players manipulate prices to trigger stop-loss orders. This practice, also known as stop hunting, is often executed by market promoters or brokers to create artificial volatility and momentum, which can lead to quick profits. Consider an example to illustrate this: Imagine you buy a stock at $100 and, based on your analysis, place a stop-loss at $98, expecting the stock to rise. But soon after, the stock dips to $98, triggering your stop-loss, before rallying up again past your entry point. This frustrating scenario is all too common among traders. So, what’s really happening here? The chosen stop-loss level, $98 in this case, was a common choice among many traders. Market observers, aware of this, drove the prices down to this level, initiating a cascade of sell orders, resulting in heightened market volatility and opportunities for informed traders to enter.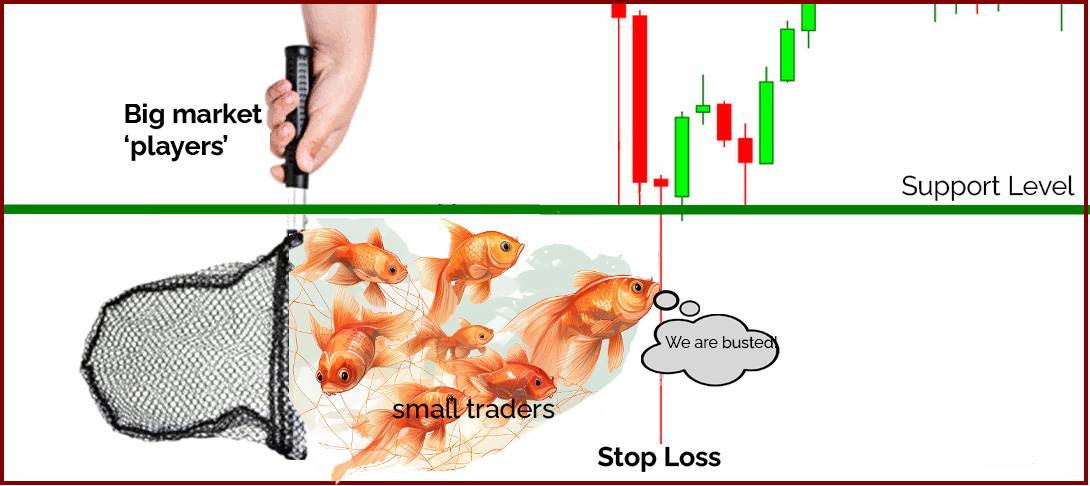 In this post, we introduce the Stop Loss Hunter Trading System, designed to capitalize on the volatility caused by stop hunting. This system, created using Amibroker AFL, has been backtested on the NSE:BANKNIFTY index.
Further Reading: In-depth Guide on Stop Loss Strategies
In this post, we introduce the Stop Loss Hunter Trading System, designed to capitalize on the volatility caused by stop hunting. This system, created using Amibroker AFL, has been backtested on the NSE:BANKNIFTY index.
Further Reading: In-depth Guide on Stop Loss Strategies
Exploring the Stop Loss Hunter Trading System
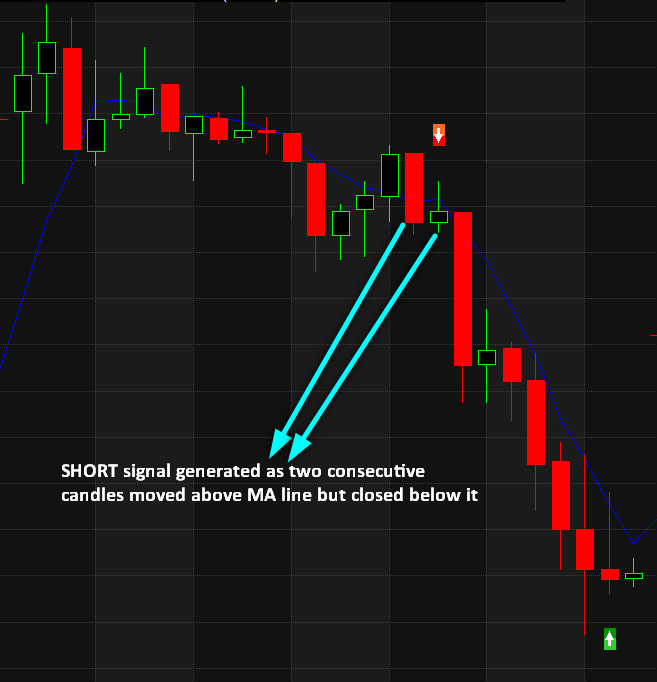
The system is built on the principle that the moving average line often serves as a stop level. We’ve used a 5-period simple moving average, adjustable as needed. This purely intraday system triggers a BUY position when two consecutive candles touch and close above the stop level. Conversely, a SHORT position is initiated when two candles touch the stop level but close below it. All positions are closed by the end of the trading day. Here’s a summary of the system’s rules:| Parameter | Value |
| Preferred Time-frame | 15 minutes |
| Indicators Used | SMA, ADX |
| Buy Conditions |
|
| Short Conditions |
|
| Sell Condition | Sell when conditions mirror Short, or time is >= 15:15 |
| Cover Condition | Cover when conditions match Buy, or time is >= 15:15 |
| Stop Loss | 0.5% |
| Targets | 5% |
| Position Size | 150 (fixed) |
| Initial Equity | 200000 |
| Brokerage | 100 per order |
| Margin | 10% |
Stop Loss Hunter AFL Code
Import this AFL into Amibroker and start enhancing your trading strategy.A Closer Look: AFL Screenshot
Examine some screenshots from the Amibroker chart demonstrating the system:

Further Reading: Master the Markets: The DEMA and RSI Trading System Explained
Analyzing the Stop Loss Hunter System – Backtest Report
This system boasts an impressive risk-reward ratio with limited drawdowns during backtesting. We tested it on the NSE:BANKNIFTY index, but it should yield similar results in other volatile instruments.
The system achieves an annual CAGR of 39.38%, outperforming many other systems we have evaluated.
| Parameter | Value |
| NSE:BANKNIFTY | |
| Initial Capital | 200000 |
| Final Capital | 3360562.00 |
| Scrip Name | NSE Banknifty |
| Backtest Period | 01-Jan-2012 to 30-Jun-2020 |
| Timeframe | 15 Minutes |
| Net Profit % | 1580.28% |
| Annual Return % | 39.38% |
| Number of Trades | 1772 |
| Winning Trade % | 39.16% |
| Average holding Period | 7.50 periods |
| Max consecutive losses | 17 |
| Max system % drawdown | -17.51% |
| Max Trade % drawdown | -22.85% |
Access the detailed backtest report here.
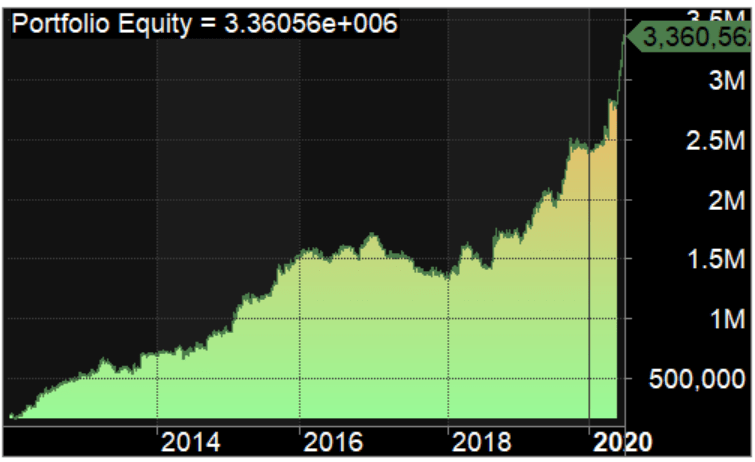
Equity Curve Analysis
Observe the equity curve below, showing how the capital grew over time with this system:
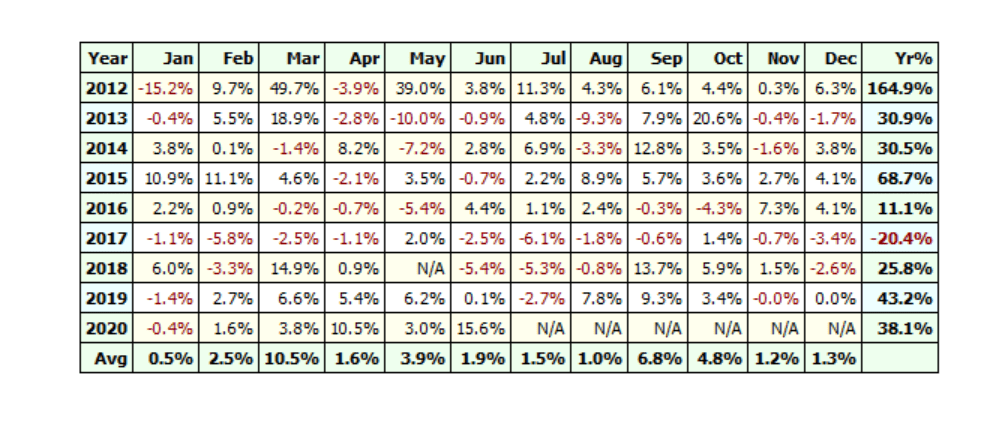
Yearly Profit Analysis
Except for 2017, this system has consistently been profitable each year since 2012.
 If you’re keen on learning and building your own Algorithmic trading systems, explore our collection of AFL codes here.
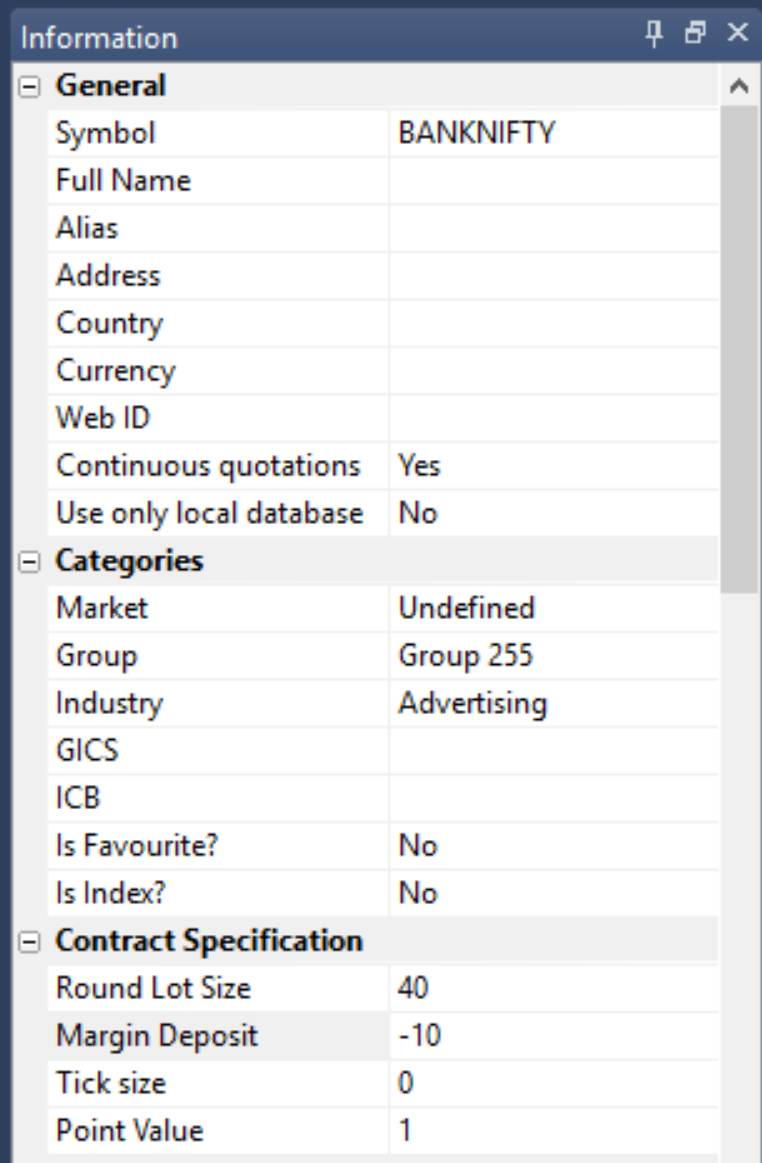
Additional Amibroker Settings for Backtesting
To optimize backtesting, go to Symbol–>Information in Amibroker, and specify the lot size and margin requirement. The screenshot below shows the lot size of 25 and a margin requirement of 10% for NSE BANKNIFTY:


3 Comments