

Price Action Trading: The Power of the Master Candle Pattern
Without a doubt, Price Action Trading stands as a highly effective method to forecast stock market movements. It’s a scientifically backed approach that employs specific chart patterns and supply-demand analysis to anticipate stock prices. Among these patterns, the Master Candle Pattern emerges as a potent yet lesser-known technique used by seasoned traders.
This post delves into the Master Candle with practical examples and its application in trading strategies.
Further Reading: Discover the 3 Most Accurate Candlestick Patterns
Understanding the Master Candle
A Master Candle is a significant candle that encompasses the range of the subsequent four candles on the chart. In essence, the high of a Master Candle exceeds the highs, and its low undercuts the lows of the next four candles.
Take a look at this example:
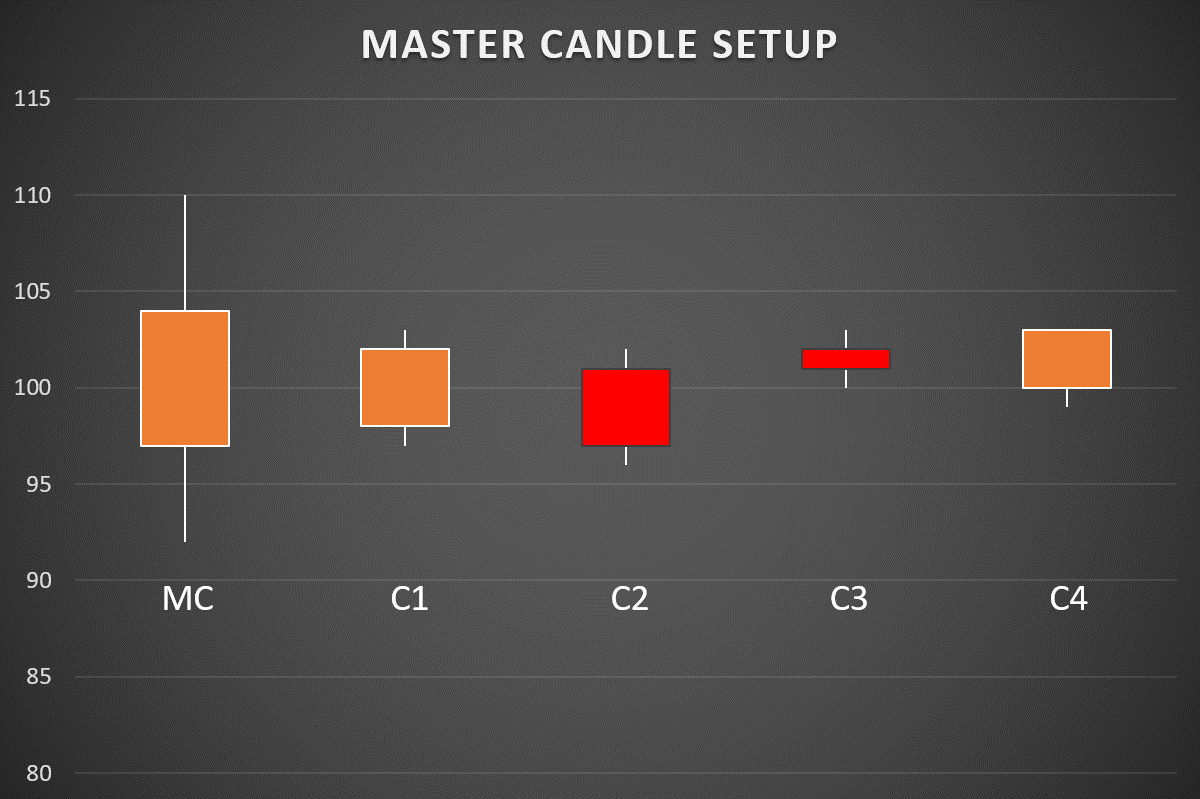
Here, ‘MC’ represents a Master Candle that completely engulfs the four subsequent candles, labeled as C1, C2, C3, and C4.
The Significance of a Master Candle
The Master Candle indicates a moment where prices consolidate within a narrow range, showcasing a tug-of-war between bulls and bears. The four child candles following the Master Candle depict the market’s indecision. Optionally, you might consider only the first three child candles, overlooking the fourth.
Since the market is largely influenced by crowd psychology, the Master Candle aptly symbolizes this collective behavior and the struggle to dictate the price direction.
Additional Reading: Price Action Trading: A Beginner’s Guide
Strategies for Trading the Master Candle
The most common interpretation of the Master Candle is to trade its breakout. The setup usually involves a mother candle and four child candles contained within its range. When any subsequent candle outside this sequence breaks above or below the mother candle, it indicates that either the bulls or bears have gained control, potentially continuing this trend for a while.
Here are some examples:

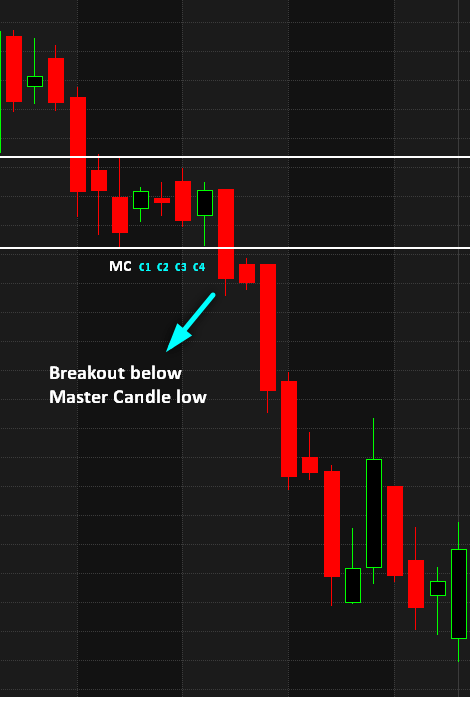
Thus, the strategy involves placing a buy order when the price breaks above the Master Candle’s high, and a short order when it breaks below its low. However, it’s advisable to monitor only 3-4 candles after the Master Candle setup for a breakout, as anything beyond that could invalidate the pattern.
Setting Stops and Targets
Place stops at the high or low of the Master Candle, depending on your trade. For example, if you go long following the breakout of the Master Candle’s high, then set your stop at its low. If the Master Candle’s range is extensive, consider setting the stop loss at the lowest low of the child candles.
The ideal target should equal the size of the Master Candle. For instance, if you enter at a price of 100 and the Master Candle’s range (High-Low) is 10, aim for a profit target of 110.
Optimal Timeframes for Master Candle Trading
The Master Candle strategy excels in both Intraday and End-of-Day (EOD) timeframes. For intraday trading, a timeframe of 30 minutes or more is preferable, as shorter timeframes like 5 minutes might be too erratic.
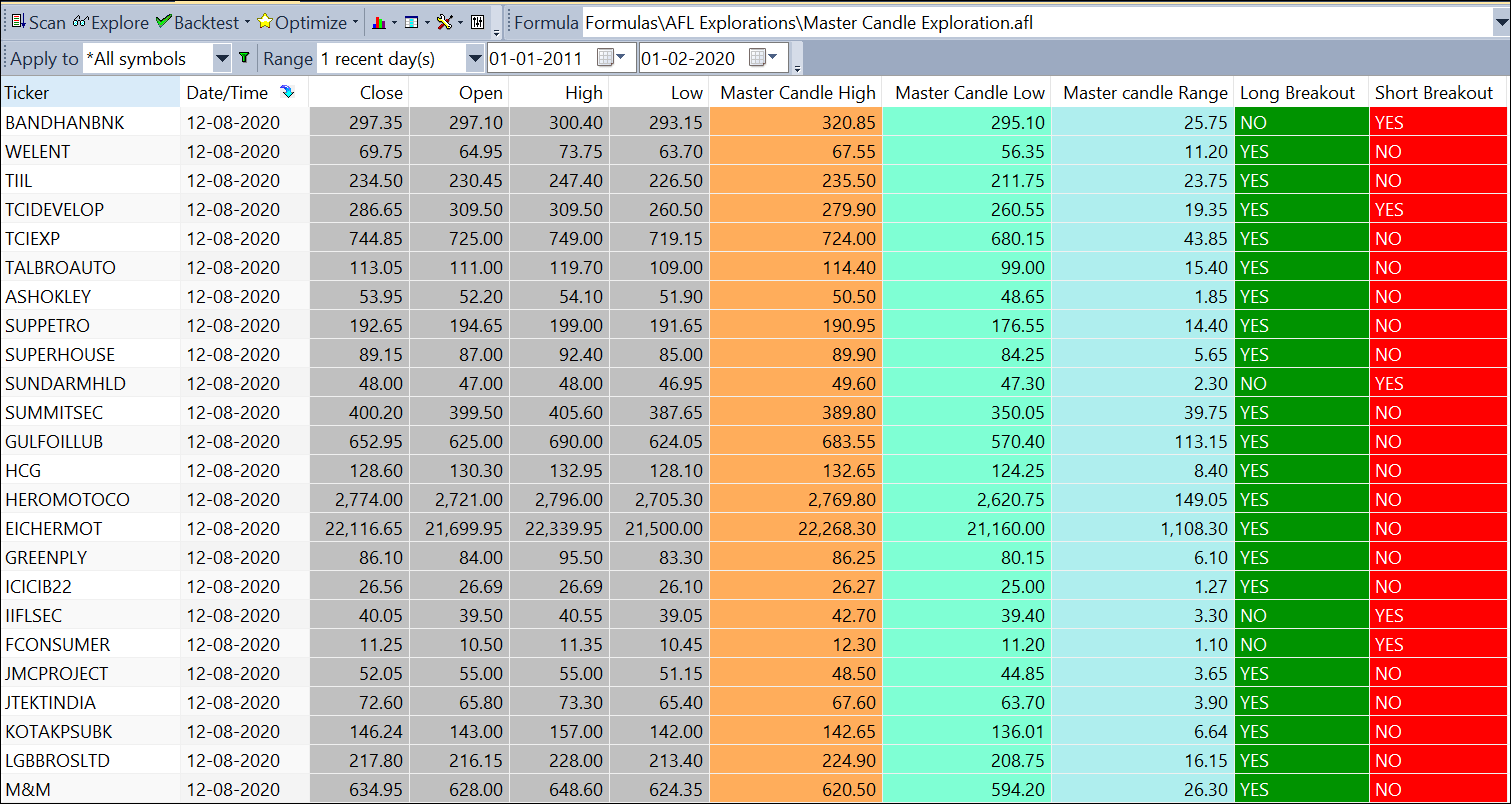
Master Candle AFL Exploration Code
Access the exploration code for Master Candle breakouts using the link below:
Master Candle Exploration AFL with Breakout Levels
Concluding Thoughts on Master Candle
The Master Candle setup has proven to be highly effective over the years. While its breakout accuracy ranges between 30-50%, the risk-reward ratio is particularly favorable. Following a Master Candle-based strategy consistently can yield profitability in the long term.


One Comment