
Mastering Stop Loss with ATR: It’s undeniable that a Stop Loss is critical in any trading strategy. Trading without one is like skydiving without a parachute. Although the fixed stop loss is common, it’s not always the best choice. In this article, we explore a superior approach to managing stop losses using the Average True Range (ATR) and show you how to calculate an ATR based stop loss in Excel.
Also Read: All you wanted to know about Stop Loss Strategies
Limits of Fixed Stop Loss
One major drawback of a standard stop loss is its inflexibility—it’s often set as a fixed percentage. For instance, you might set a stop loss at 2% after entering a trade.
While this method works in stable markets, in volatile conditions, you’re more likely to hit your stop loss, only to see the price reverse direction.
Many traders, maybe even you, have fallen into this trap of stop-loss hunting, resulting in significant losses.
ATR Stop Loss: A Dynamic Solution
An ATR based stop loss adapts to market changes. Traders can set wider stop losses in volatile markets and narrower ones when things are calmer.
ATR, a standard volatility measure, is typically calculated over 14 periods. A high ATR indicates a volatile market, while a low ATR suggests less volatility. This dynamic approach prevents premature stop-loss triggers.
Also Read: How to calculate Stop Loss in an Excel Sheet?
Calculating ATR Based Stop Loss in Excel
The calculation starts with the True Range (TR), which is the greatest of the following:
- Difference between Current High and Current Low
- Difference between Current High and Previous Close
- Difference between Current Low and Previous Close
We use absolute values if the result is negative.
ATR is then determined by this formula:
Current ATR = [(Previous ATR x (n-1)) + Current TR] / n, where n = time period for ATR
The initial TR is simply the High minus the Low, and the first ATR is an average of daily TR values over n days.
We’ve already incorporated these calculations in our Excel sheet. See the screenshot below:
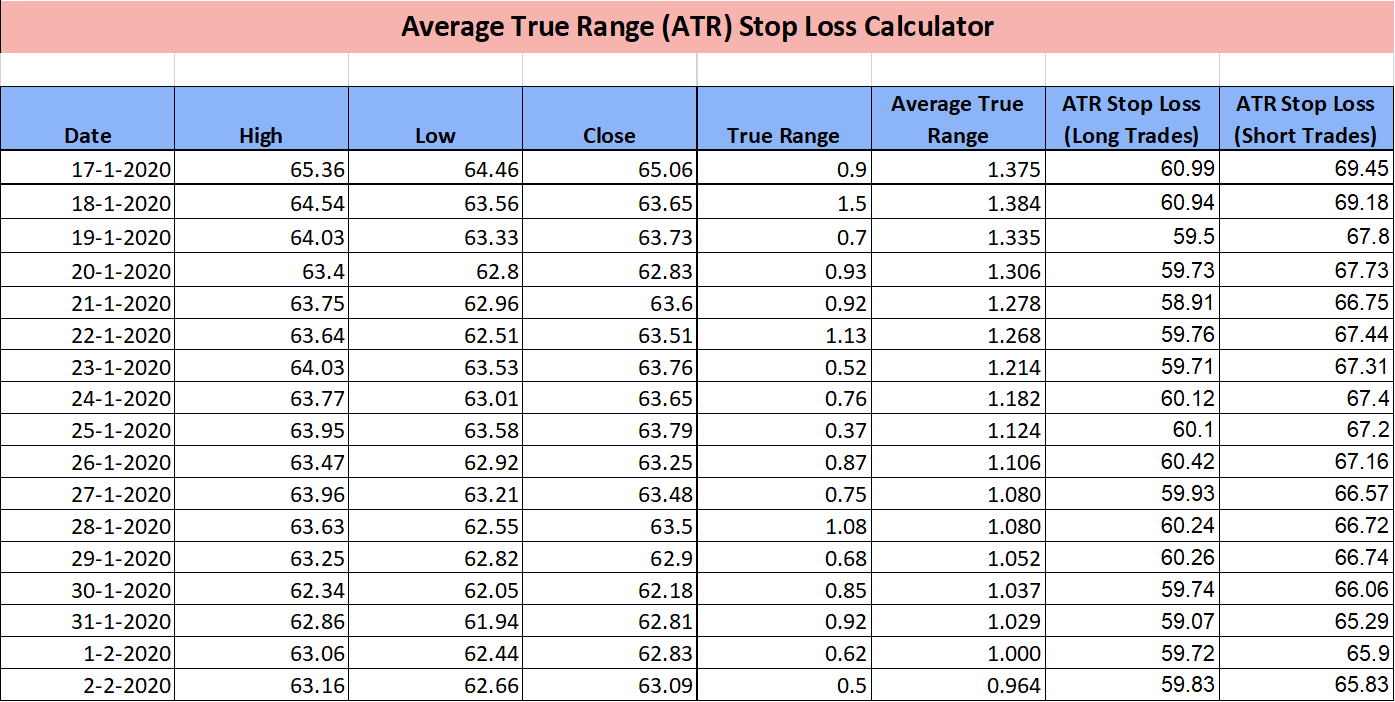
For long trades, subtract ATR*3 from the Close price to set the stop loss. For short trades, add ATR*3 to the Close price. While 3 is a common multiplier, you can also try 2 for a tighter stop loss. Ideally, you should apply this to your trade entry price, not just the closing price.
Using the ATR Stop Loss Excel Sheet
The Excel sheet is user-friendly.
Simply input High, Low, and Close prices along with dates in the first four columns, and the sheet does the rest.
Ensure you have at least 14 data points to calculate the 14-period ATR effectively.
Then, use the previous day’s ATR to set the current day’s stop loss.
Download Excel Sheet
Download the Excel sheet here:
ATR Stop Loss Calculator Excel Sheet
We hope this article helps you. If you have questions, feel free to ask in the comments.