

Struggling to Predict Stock Movements?
Are you finding it challenging to forecast whether stock prices will rise or fall? You’ve applied various technical and fundamental analyses, yet your predictions often prove inaccurate. No worries; we have a solution to help you overcome this hurdle. Enter the realm of delta-neutral option strategies, which enable you to profit from the market regardless of its direction. These strategies focus on stock volatility rather than its price movement, rendering it irrelevant whether the stock is ascending or descending. Intrigued? Let’s delve deeper.
Understanding Delta Neutrality
Delta, one of the “Greeks” associated with options, indicates how an option’s price will change for every 1-unit shift in the underlying asset’s price. For example, a call option with a Delta of 0.5 will change by 0.5 units for every 1-unit shift in the underlying asset’s price. Call options have a positive Delta, while put options have a negative Delta. Delta neutrality refers to a strategy where the sum of all your positions’ Delta values equals zero. Such a strategy remains unaffected by any positive or negative movements in the underlying asset’s price. You can create delta-neutral strategies using options alone or a combination of futures and options. In the next section, we’ll explore some popular delta-neutral option strategies and their payoff graphs.
For a better understanding of Option Greeks, take a look at this Option Greeks Calculator Excel Sheet.
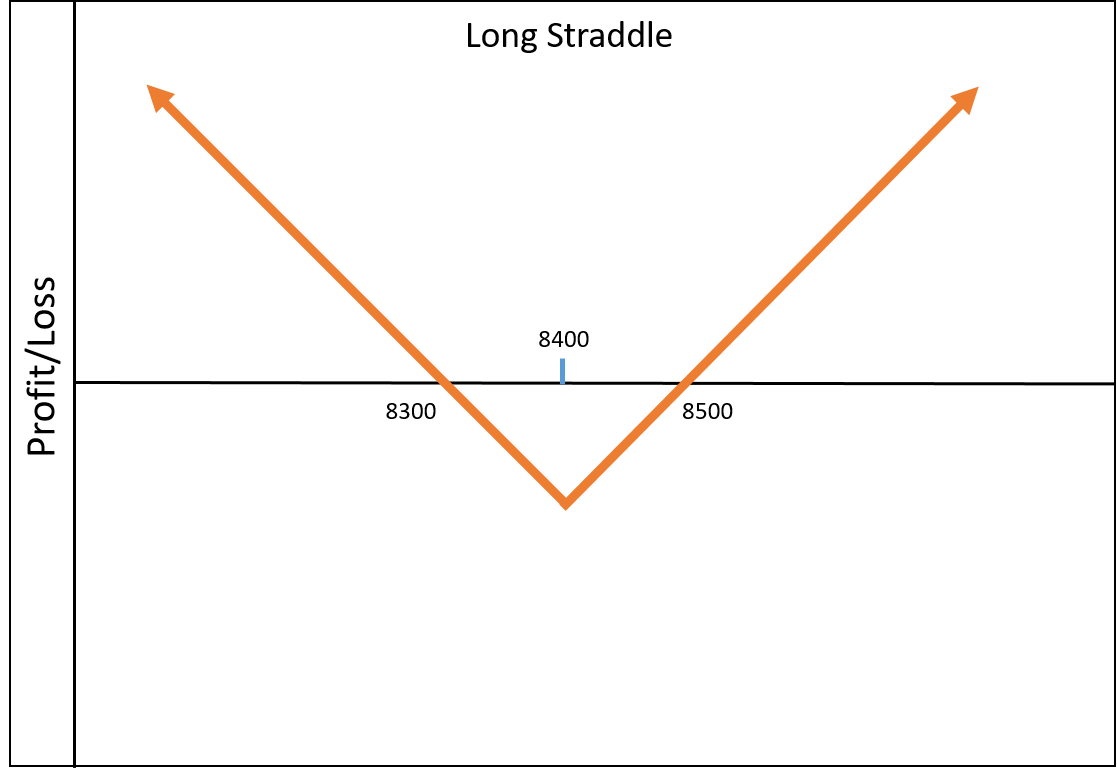
The Long Straddle Strategy
The Long Straddle strategy involves purchasing an equal quantity of at-the-money (ATM) call and put options. For example, if the Nifty is trading at 8410, you would acquire the 8400 CE and 8400 PE options. The call option’s positive Delta is offset by the put option’s negative Delta, making the strategy Delta neutral. This strategy incurs a net debit, and the breakeven point depends on the strike prices of the options purchased.
Here are some key features of the Long Straddle strategy:
- Potential Profit: Unlimited
- Maximum Loss: The net debit paid (the amount spent on buying both the call and put options)
- Breakeven Point: Strike price of the Call Option – Net Debit paid or Strike price of the Put Option + Net Debit paid
- When to Use This Strategy: Implement this strategy when you anticipate significant price swings but are uncertain about the direction. For instance, during earnings announcements, the Union budget, election results, and similar events.
Example: Suppose the Nifty is trading at 8410, and you’ve bought one lot of 8400 CE and one lot of 8400 PE. If the price makes a substantial move the next day, your call options will yield significant profits if it rises, while the put options become practically worthless. If the price drops, your put options will generate substantial profits, rendering the call options worthless. In essence, the price’s direction has no effect. However, if the price remains stable for a few days, both call and put option prices will gradually decrease due to time decay.
Here’s the payoff graph for this strategy:
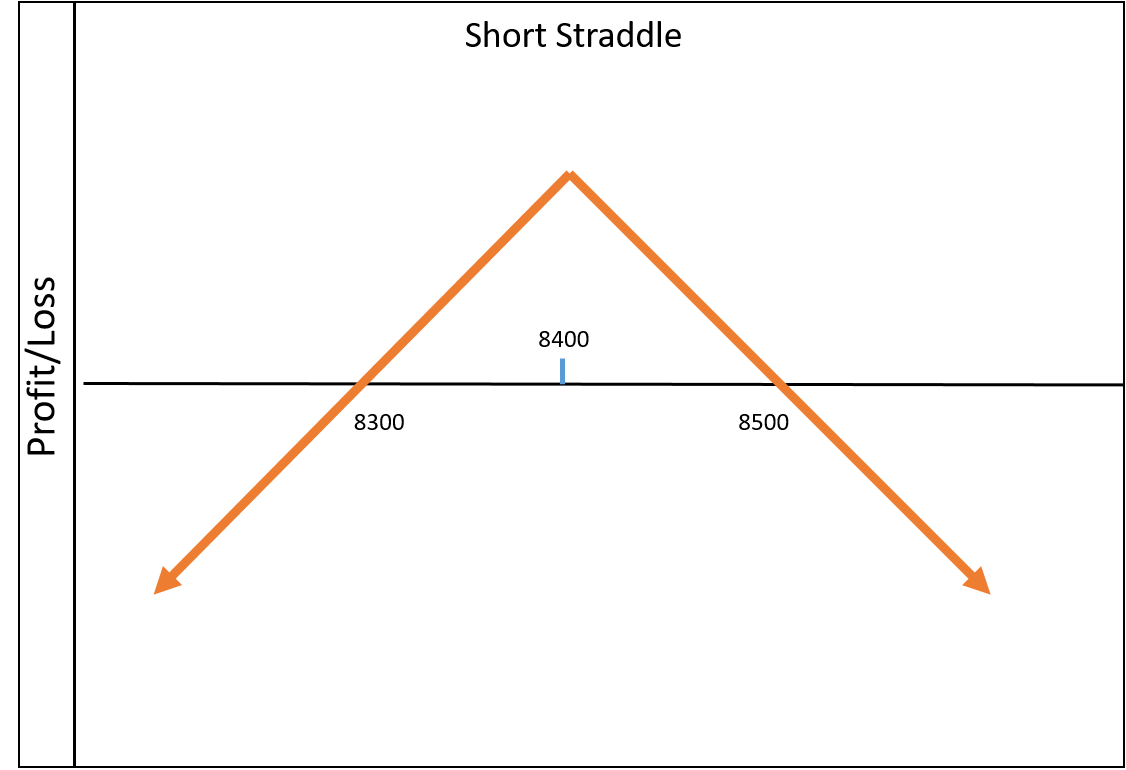
The Short Straddle Strategy
The Short Straddle strategy involves writing an equal quantity of ATM call and put options. For example, if the Nifty is trading at 8410, you would sell the 8400 CE and 8400 PE options. The sold call option’s negative Delta is offset by the sold put option’s positive Delta, making the strategy Delta neutral. This strategy generates a net credit, but executing it may require margin to be blocked in your account.
Here are some key features of the Short Straddle strategy:
- Potential Profit: Limited to the net credit received from selling options
- Maximum Loss: Unlimited
- Breakeven Point: Strike price of the Call Option – Net Credit received or Strike price of the Put Option + Net Credit received
- When to Use This Strategy: Implement this strategy when you expect minimal stock price movement or a consolidation phase, such as during holiday seasons or after earnings announcements when volatility decreases sharply.
Example: Suppose the Nifty is trading at 8410, and you’ve sold one lot of 8400 CE and one lot of 8400 PE. You anticipate minimal price movement in the coming days and, therefore, hold this position overnight. If the Nifty opens the next day at the same price (8410), both your call and put options will be profitable due to time decay. Even slight price movements higher or lower won’t result in losses since one position hedges the other. However, significant price swings can lead to substantial losses.
Here’s the payoff graph for this strategy:
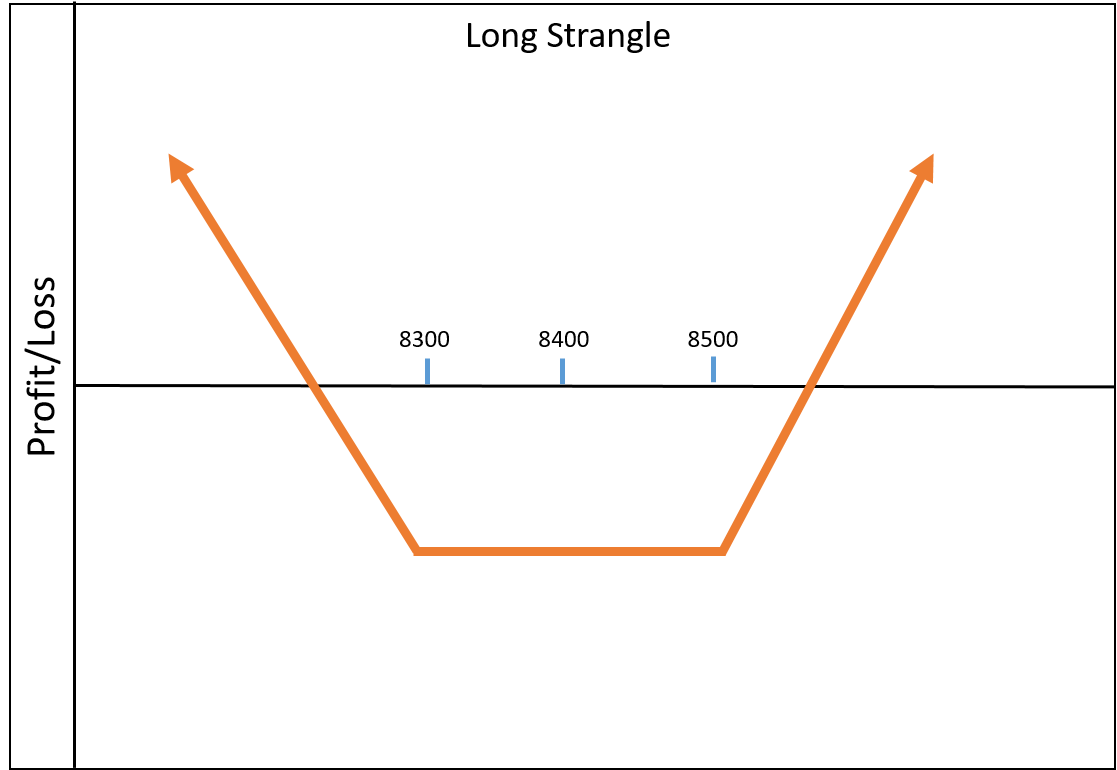
Long and Short Strangle Strategies
The Long and Short Strangle strategies are similar to Straddles, but with a key difference: in Strangles, you buy/sell out-of-the-money (OTM) options, whereas Straddles involve buying/selling ATM options.
For the Long Strangle, purchasing OTM options reduces the premium paid but shifts the breakeven point to a higher value. All other characteristics remain the same as the Long Straddle. Here’s the payoff graph:
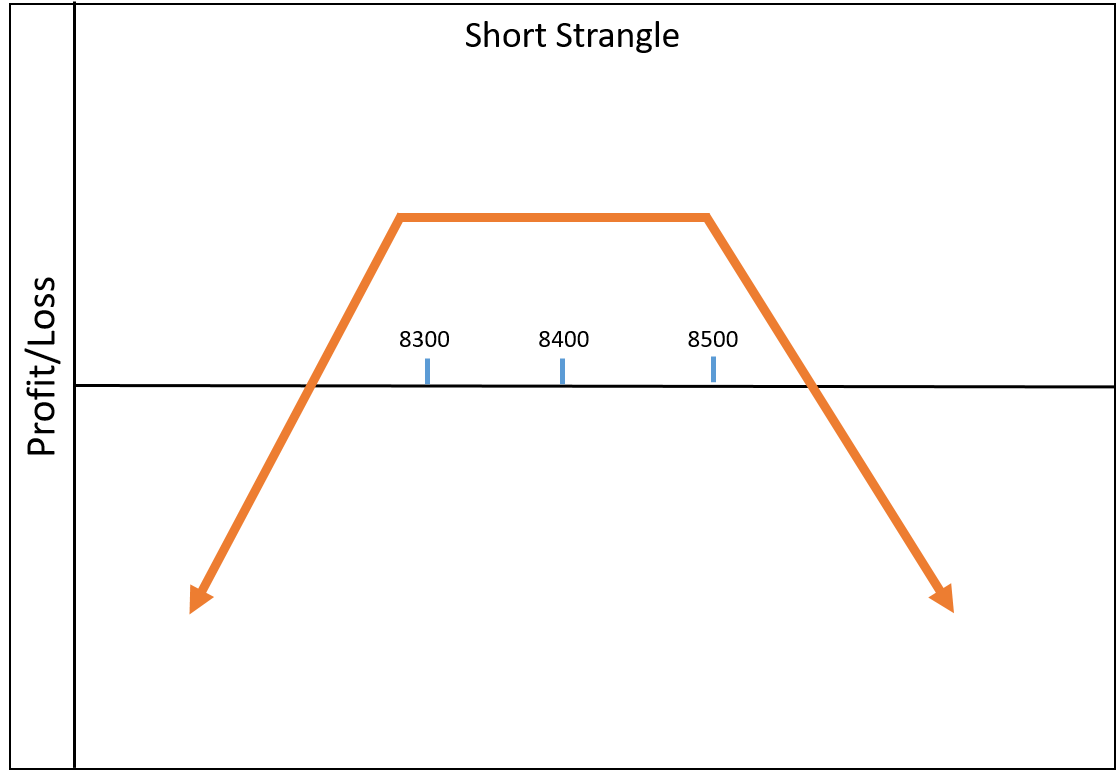
In the Short Strangle, changing the option strike prices increases the probability of a winning trade, but the net profit value decreases due to the discounted rates of OTM options. Here’s the payoff graph for the Short Strangle:
Explore More Delta Neutral Option Strategies
Straddles and Strangles are among the most prominent Delta-neutral option strategies. You can explore numerous other Delta-neutral trades using combinations of options and futures. While there’s no guarantee of a 100% success rate for any strategy, they can certainly enhance your probabilities. If you have any questions about the strategies discussed, feel free to reach out. Discover additional options-related theories and strategies in this Option Trading Archives.

2 Comments