
Discover the potential of the Keltner Band, a remarkable tool akin to the Donchian Band, to accurately spot trend breakouts. For veteran traders, snagging the right trend breakouts is like stumbling upon a treasure. Unlike the Bollinger band that relies on standard deviation, the Keltner band hinges on the ATR (average true range). In this guide, we’ll unveil the steps to compute the Keltner Band and delve into a trading system rooted in it. This system has undergone a backtest on NSE Nifty spanning 18 years, showcasing reliable results.

Dive into AFL coding here and set out to create your own trading systems.

Unpacking the Keltner Band Calculation

The Keltner Band is a tribute to Chester W. Keltner (1909–1998), who unveiled it in his 1960 book How To Make Money in Commodities.

Picture a central moving average line bordered by an upper and lower band. These bands derive from the average true range (ATR) of the price.

Here’s how you calculate the Keltner Band:

Central Line = 20-period moving average

Upper Keltner Band = Central Line + Multiplier * ATR(Periods)

Lower Keltner Band = Central Line – Multiplier * ATR(Periods)

The default settings are a multiplier of 2 and periods of 10.

You can tweak these constants based on your trading asset and timeframe.

Exploring the Keltner Band Trading System: An AFL Overview

ParameterValue
Preferred Time-frame
Daily
Indicators UsedATR, Bollinger Bands
Buy ConditionHigh value of candle crosses above Keltner upper band
Short ConditionLow value of candle crosses below Keltner lower band
Sell ConditionLow value of candle crosses below Keltner middle band
Cover ConditionHigh value of candle crosses above Keltner middle band
Stop LossNo defined SL
TargetsNo defined target
Position Size150 (fixed)
Initial Equity200000
Brokerage100 per order
Margin10%

Snapshot and Code of the Keltner Band Trading System

				
					//------------------------------------------------------
//
//  Formula Name:    Keltner  Channel trading System
//  Website:         https://zerobrokerageclub.com/
//------------------------------------------------------

_SECTION_BEGIN("Keltner Channel trading System");

SetChartOptions(0,chartShowArrows|chartShowDates);
_N(Title = StrFormat("{{NAME}} – {{INTERVAL}} {{DATE}} Open %g, Hi %g, Lo %g, Close %g (%.1f%%) {{VALUES}}", O, H, L, C, SelectedValue( ROC( C, 1 ) ) ));

//Initial Parameters
SetTradeDelays( 0,0,0, 0 );
SetOption( "InitialEquity", 200000);
SetOption("FuturesMode" ,True);
SetOption("MinShares",1);
SetOption("CommissionMode",2);
SetOption("CommissionAmount",50);
SetOption("AccountMargin",10);
SetOption("RefreshWhenCompleted",True);
SetPositionSize(150,spsShares);
SetOption( "AllowPositionShrinking", True );

Plot( Close, "Price", colorWhite, styleCandle );

//Keltner Band Code
KMid = MA (Close, 20);	//Middle Line
ATRPeriod = 10; 		//ATR Period
KFactor = 2;			//Multiplier
KValue = ATR(ATRPeriod) * KFactor; 
KTop = KMid + KValue;	//Upper Band
KBottom = KMid - KValue;	//Lower Ban

 
printf("\nKTop : " + KTop );  
printf("\nKBottom : " + KBottom );  
printf("\nKMid : " + KMid );  

Plot(KTop,"KTop",colorBlue,styleLine);
Plot(KMid,"KMid",colorGreen,styleLine);
Plot(KBottom,"KBottom",colorRed,styleLine);


Buy=Cross(High,KTop);
Short=Cross(KBottom,Low);
Sell=Cross(KMid,Low);
Cover=Cross(High,KMid);

BuyPrice=KTop;
SellPrice=KMid;
ShortPrice=KBottom;
CoverPrice=KMid;

Buy = ExRem(Buy,Sell);
Sell = ExRem(Sell,Buy);
Short=ExRem(Short,Cover);
Cover=ExRem(Cover,Short);


printf("\nBuy : " + Buy );  
printf("\nSell : " + Sell );  
printf("\nShort : " + Short );  
printf("\nCover : " + Cover );  

/* Plot Buy and Sell Signal Arrows */
PlotShapes(IIf(Buy, shapeSquare, shapeNone),colorGreen, 0, L, Offset=-25);
PlotShapes(IIf(Buy, shapeSquare, shapeNone),colorLime, 0,L, Offset=-35);
PlotShapes(IIf(Buy, shapeUpArrow, shapeNone),colorWhite, 0,L, Offset=-30);
PlotShapes(IIf(Short, shapeSquare, shapeNone),colorRed, 0, H, Offset=25);
PlotShapes(IIf(Short, shapeSquare, shapeNone),colorOrange, 0,H, Offset=35);
PlotShapes(IIf(Short, shapeDownArrow, shapeNone),colorWhite, 0,H, Offset=-30);
PlotShapes(IIf(Sell, shapeStar, shapeNone),colorGold, 0, L, Offset=-15);
PlotShapes(IIf(Cover, shapeStar, shapeNone),colorGold, 0,L, Offset=-15);


_SECTION_END();


Below is a glimpse of the Keltner Band AFL chart from Amibroker.

Keltner-Band-ChartAlso Explore: Intraday Trend Following Strategy: MACD and Bollinger Band

Backtest Report: Keltner Band Trading System

While it may not outshine the Donchian band trading system, this system stands robust, delivering precise signals. Test it on various instruments.

ParameterValue
Nifty
Initial Capital200000
Final Capital998020.42
Scrip NameNSE Nifty
Backtest Period09-Feb-2000 to 18-May-2018
TimeframeDaily
Net Profit %399.01%
Annual Return %9.14%
Number of Trades198
Winning Trade %42.42%
Average holding Period14.74 periods
Max consecutive losses4
Max system % drawdown-29.49%
Max Trade % drawdown-87.55%

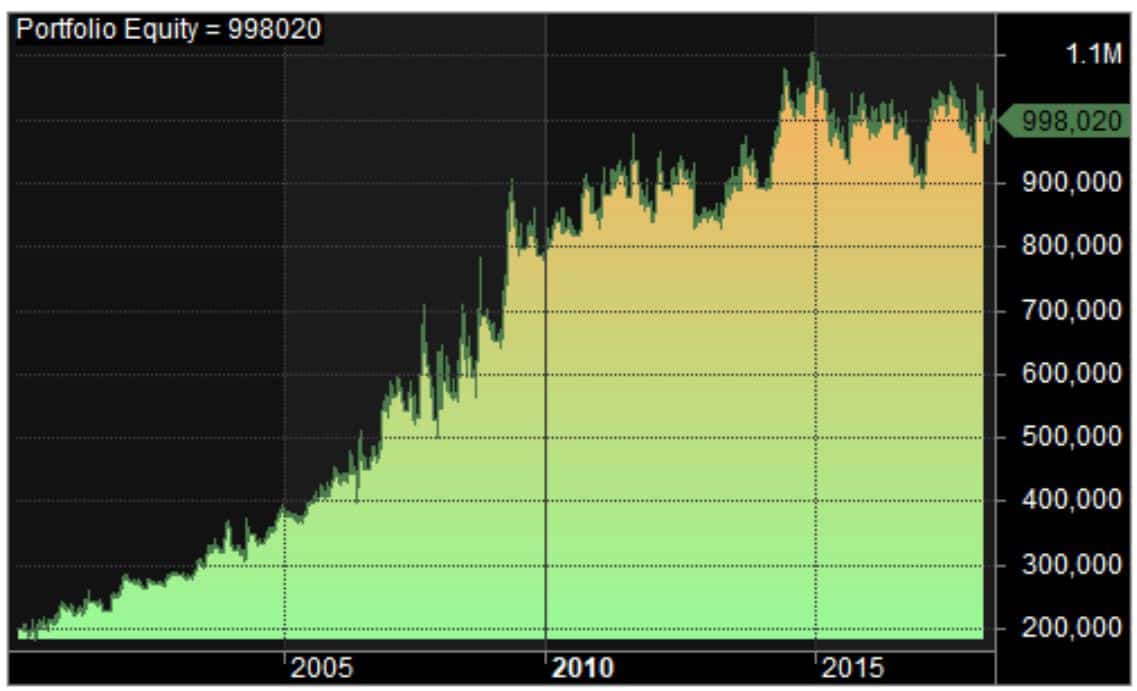
Equity Curve: A Closer Look

The equity curve showcases a steady and almost linear growth.

Keltner-Band-Equity-Curve

Profit Table: A Deep Dive

Keltner-Band-Profit-Table

Amibroker Backtesting Settings

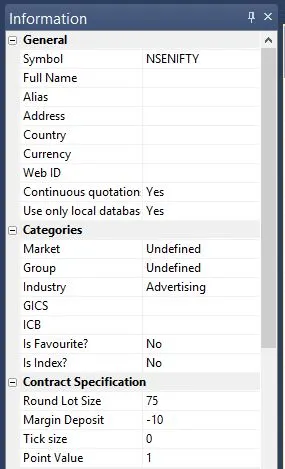
Head to Symbol–>Information to specify the lot size and margin requirement. The screenshot below depicts a lot size of 75 and a margin requirement of 10% for NSE Nifty:

Symbol-Info_Nifty