
Welcome to this follow-up article, building upon our introductory guide on Unlocking the Power of Algorithmic Trading. Assuming you’ve grasped the fundamental concepts and benefits of Algorithmic Trading, it’s time to dive into creating your own trading system from scratch. In this article, we will provide a step-by-step guide on how to develop your first Algorithmic Trading system. Our tool of choice for this endeavor is Amibroker.

Prerequisites:

  • You should have a basic understanding of Technical Analysis.
  • You need hands-on experience with Amibroker and AFL Coding.

Feel free to explore more articles related to Amibroker here.

Step 1: Crafting Your Trading Plan

The initial step involves creating a checklist of parameters that will serve as the basis for your trading decisions. These parameters should be quantifiable and devoid of any reliance on gut feelings or speculation. Your criteria could be as straightforward as time-based decisions, such as buying a particular stock on the first day of each month, or decisions grounded in technical analysis, like identifying Trendline breakouts with increasing trading volumes. You should also plan the amount you’ll invest in each transaction, your trading timeframe, and establish your stop-loss and target levels. Once you’ve formulated your plan, it’s crucial to validate it against a variety of stocks to ensure its effectiveness. This validation step is pivotal before proceeding to the next phases. If your plan proves successful at least 50% of the time and maintains a Risk-Reward ratio of at least 1:2, then you’re ready to convert it into an Algorithm.

For additional insights, you can also explore: Algorithmic Trading Courses for Beginners.

Step 2: Translating Your Idea into an Algorithm

Next, you’ll start writing the code for your formulated trading plan. This code is essentially a set of instructions that a computer can interpret to execute your Buy/Sell logic. For this purpose, we’ll be using the Amibroker Formula Language (AFL). AFL is a high-level programming language that’s straightforward to comprehend, particularly when starting from the basics. Even individuals without a background in programming can learn AFL, saving them from unnecessary expenses on pre-made AFL solutions. If you’d like to explore AFL coding from scratch, you can refer to this tutorial. As an example, let’s say you’re trading based on the exponential moving average (EMA) crossover in the daily timeframe. In this scenario, you’d purchase a stock when the 50 EMA crosses above the 200 EMA, and sell when the 50 EMA crosses below the 200 EMA. For simplicity, let’s consider this a Buy-only strategy.

Below, you’ll find the basic AFL code for this logic.

				
					_SECTION_BEGIN("Simple Algorithmic Trading System");

//Parameters

MALength1 = 50;
MALength2 = 200;

//Buy-Sell Logic

Buy = Cross(ema( C, MALength1 ),ema( C, MALength2 ));
Sell =Cross( ema( C, MALength2 ), ema( C, MALength1 )) ;

Buy = ExRem( Buy, Sell );
Sell = ExRem( Sell, Buy );

Plot( Close, "Price", colorWhite, styleCandle );
Plot(ema( C, MALength1 ),"FastEMA",colorWhite);
Plot(ema( C, MALength2 ),"SlowEMA",colorBlue);

_SECTION_END();


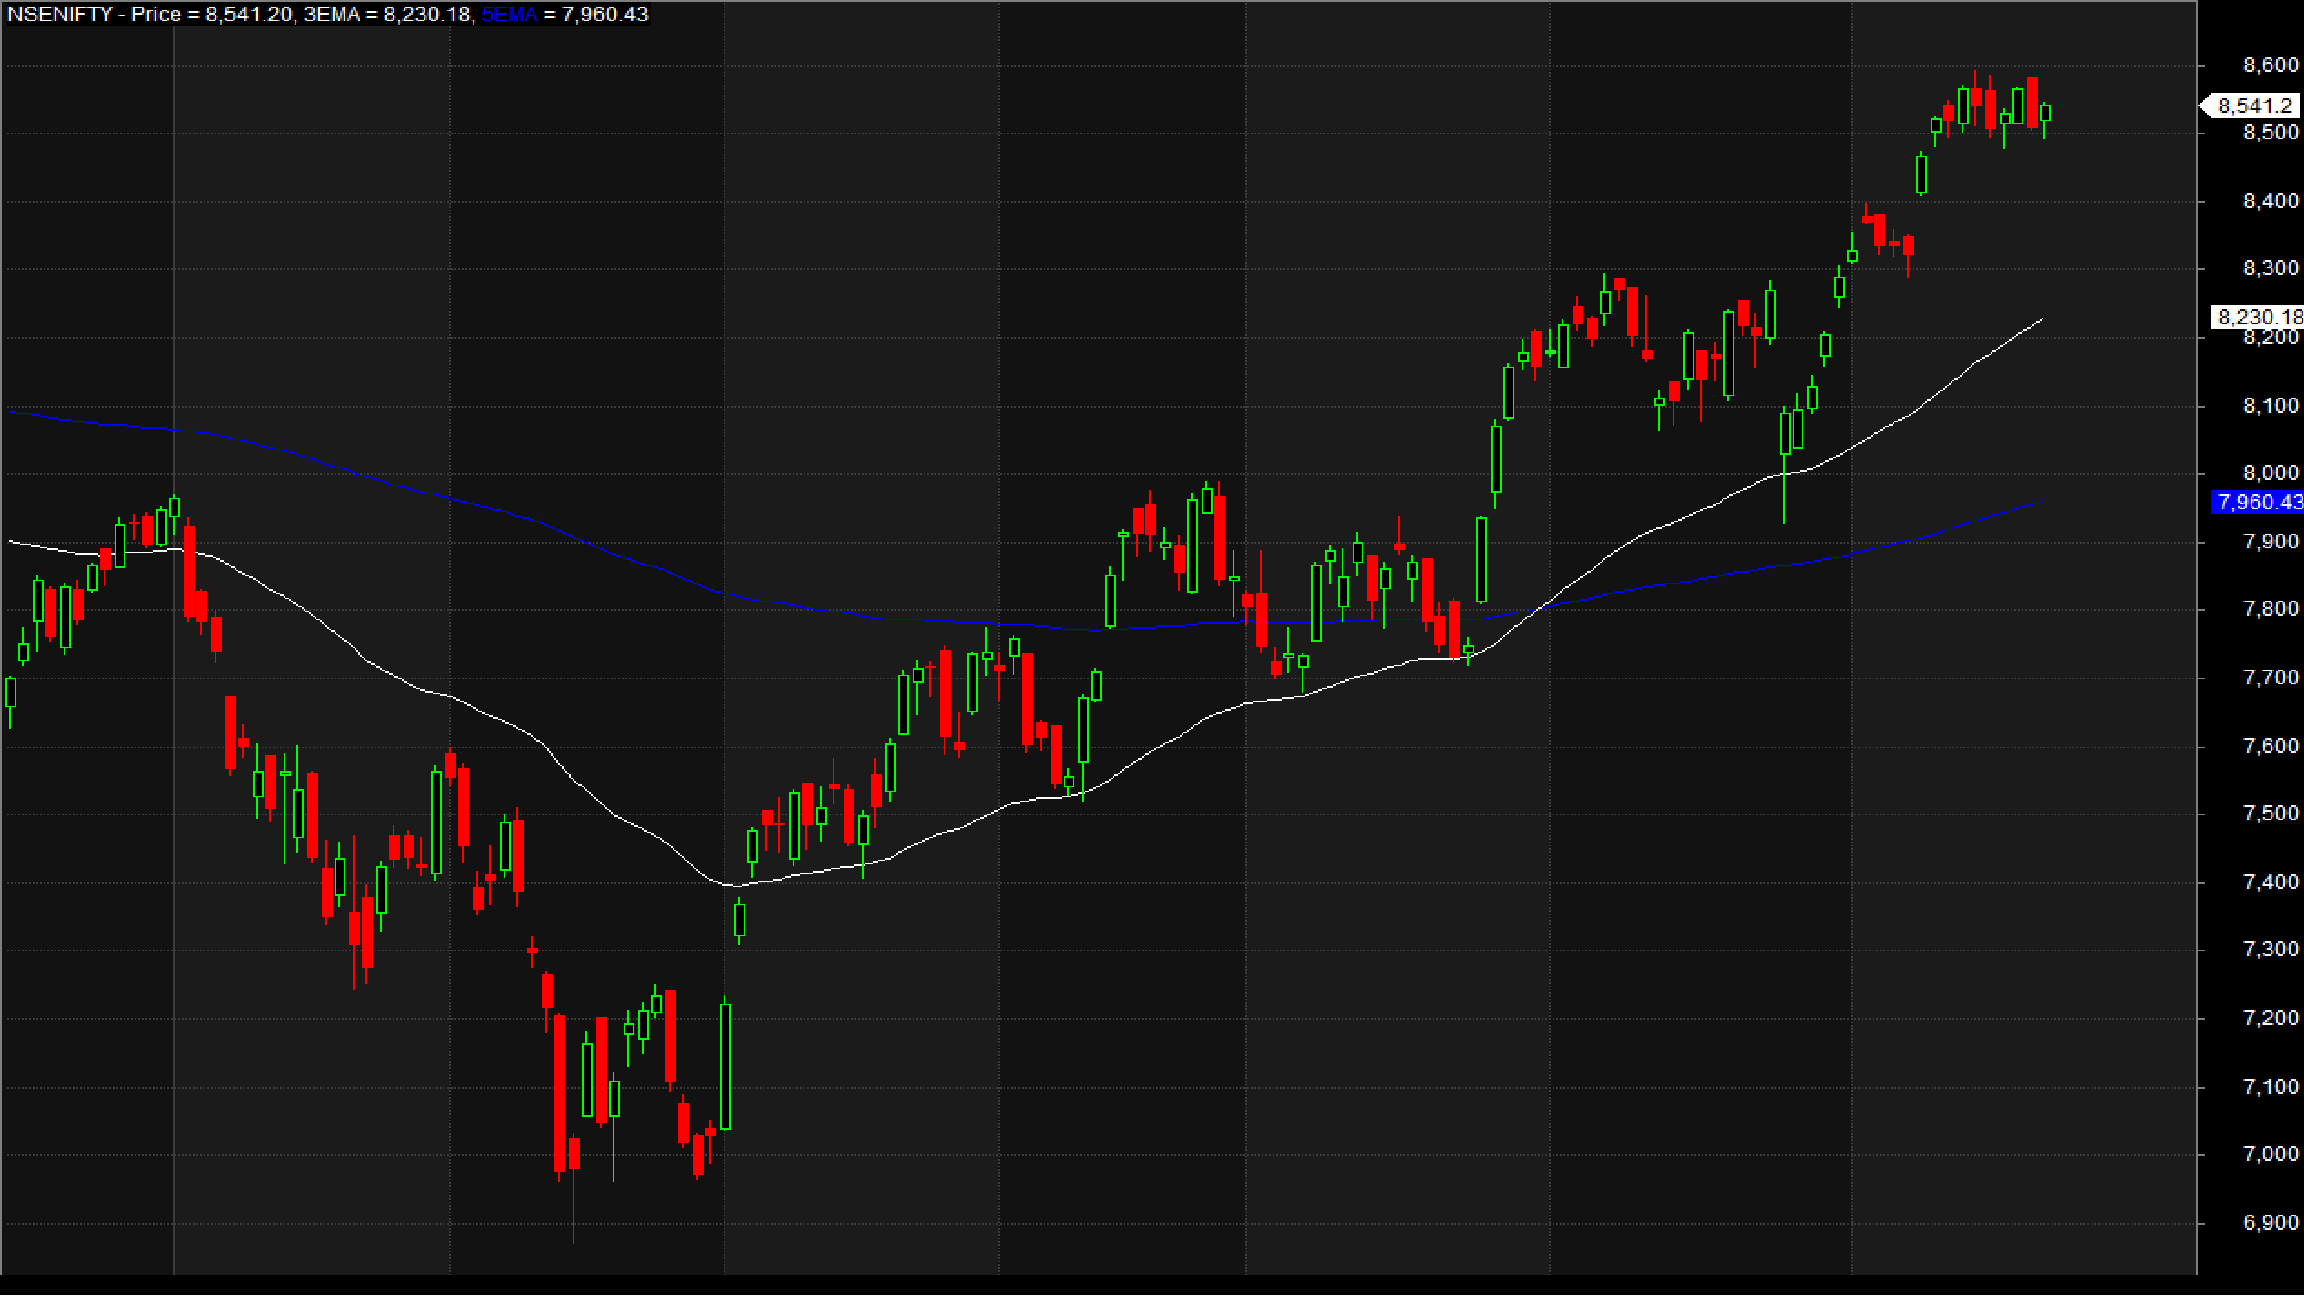
Here’s how it appears when applied on a chart:

EMA Crossover

Step 3: Evaluating Your Algorithm Through Backtesting

Backtesting is the process of assessing your Algorithm’s performance using historical data. This step is akin to what you manually did in Step 1. Fortunately, Amibroker boasts a robust backtest engine that can complete this task within seconds. All you need to do is import historical data for your preferred stocks into Amibroker. To gain a comprehensive understanding of the backtesting process within Amibroker, please refer to the official documentation link provided below.

Learn more about Backtesting your Trading ideas in Amibroker.

For the purpose of backtesting this EMA Crossover strategy, we’ll use NSE Nifty as our preferred stock, commencing with an initial capital of 200,000 Rupees. Let’s assume that we purchase 2 lots (150 units) per transaction. Upon completing this backtest, you’ll receive a detailed report that includes key metrics such as your Annual CAGR, Drawdown, Net Profit/Loss percentage, and more. You can delve into various parameters by exploring the Amibroker Backtest report here.

Here’s a summary of our initial backtest:

ParameterValue
Nifty
Initial Capital200,000
Final Capital1,037,655
Backtest Period26-Mar-2002 to 23-July-2016
Net Profit %418.83%
Annual Return %10.45%
Number of Trades11
Winning Trade %54.55%
Average Holding Period227.91 days
Max Consecutive Losses2
Max System % Drawdown-33.24%
Max Trade % Drawdown-29.94%

While this performance is decent, there’s room for improvement. The drawdown is slightly on the higher side, which could pose challenges for retail investors.

To continue reading this article, please follow this link.