
Getting Started with Intraday Trading: If you’re new to intraday trading, it’s vital to monitor key factors for success. These include chart patterns, technical indicators, and market news. In this guide, we focus on the best indicators for intraday trading to enhance your success rate and risk-reward ratio.
Essential Indicators for Intraday Trading
Out of the many technical indicators in classic analysis, we’ve handpicked the best for day trading. While some indicators like the RSI work well for long-term trades, they may not be as effective for day trading. Here are the top seven indicators for intraday trading:
1. VWAP – Gauge the Market
The Volume Weighted Average Price (VWAP) is crucial for predicting stock movements in day trading. It averages stock prices over time, weighted by trading volume. Prices below VWAP suggest undervaluation, while those above indicate overvaluation. VWAP also acts as a dynamic support or resistance line and helps in identifying market trends.

Learn More: Mastering Intraday Trading: A 7-Point Strategy for Success
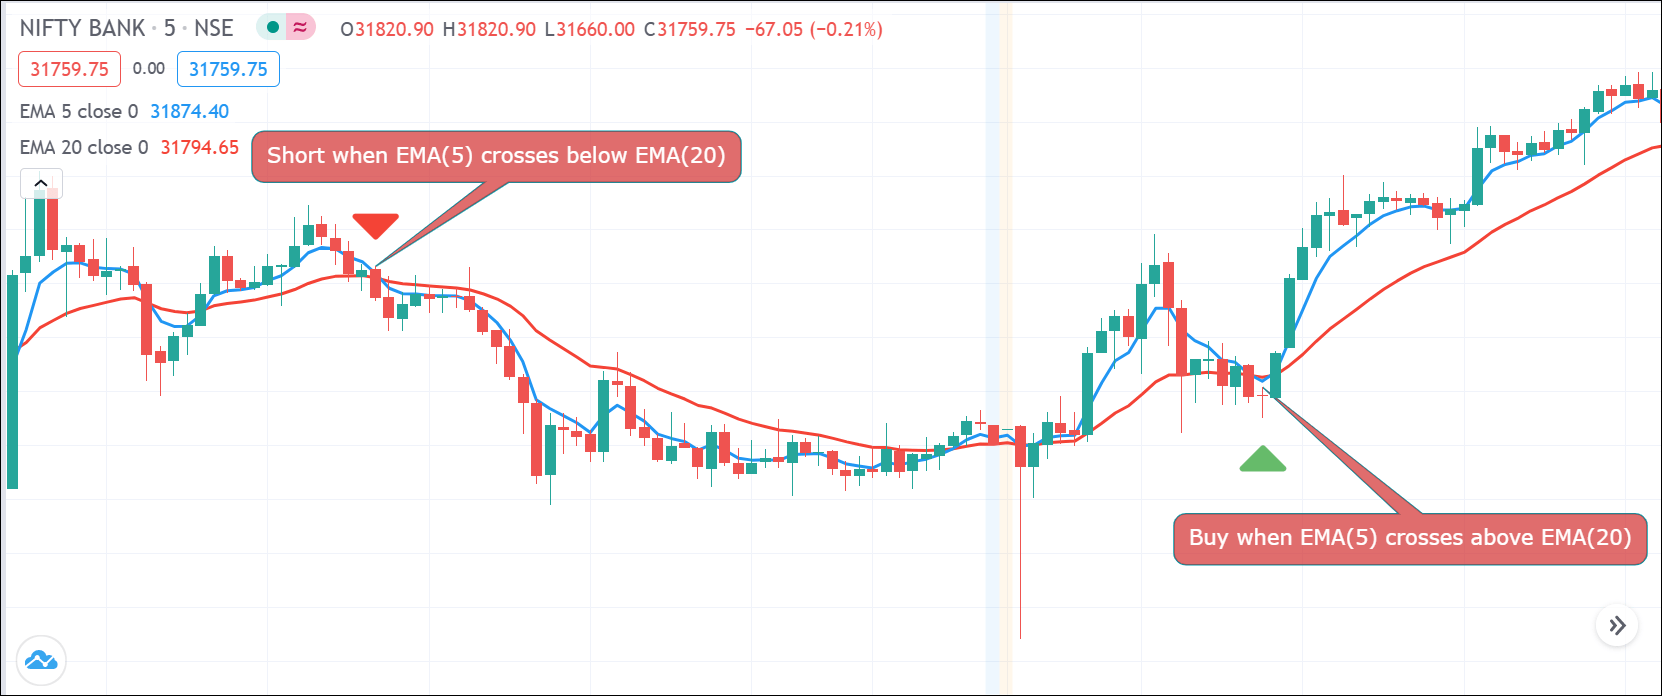
2. EMA – The Popular Trend Indicator
The Exponential Moving Average (EMA) stands out among moving averages. It gives more weight to recent prices, making it ideal for intraday trading. Look for EMA crossovers to decide when to buy or sell. For instance, buy when a short-term EMA crosses above a long-term EMA, and sell in the reverse scenario.
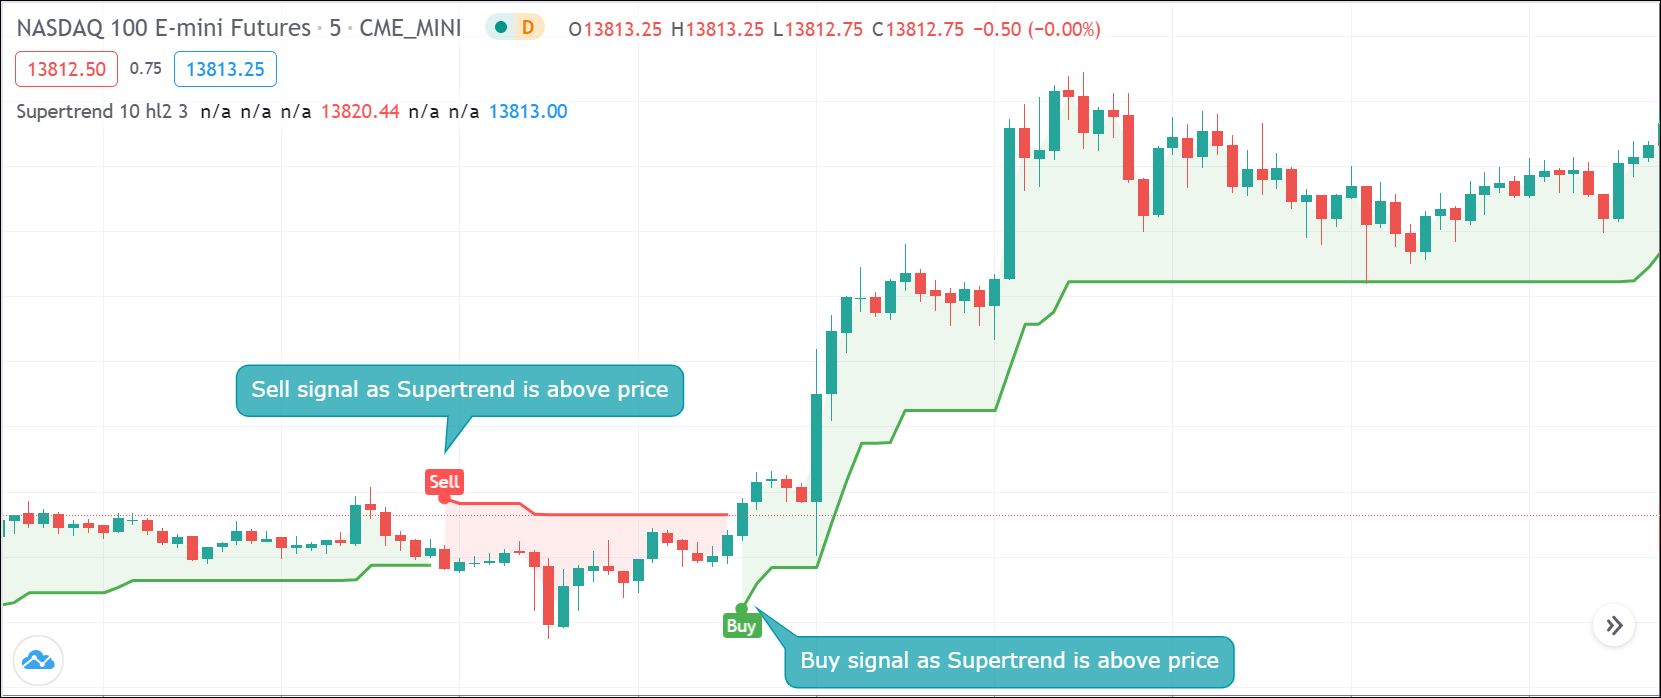
3. Supertrend – For Accurate Trend Following
The Supertrend indicator excels in the intraday timeframe, tracking trends with precision. It’s effective for various instruments and uses the Average True Range (ATR) for calculations. A buy signal appears when Supertrend closes above the price, and a sell signal when it closes below.
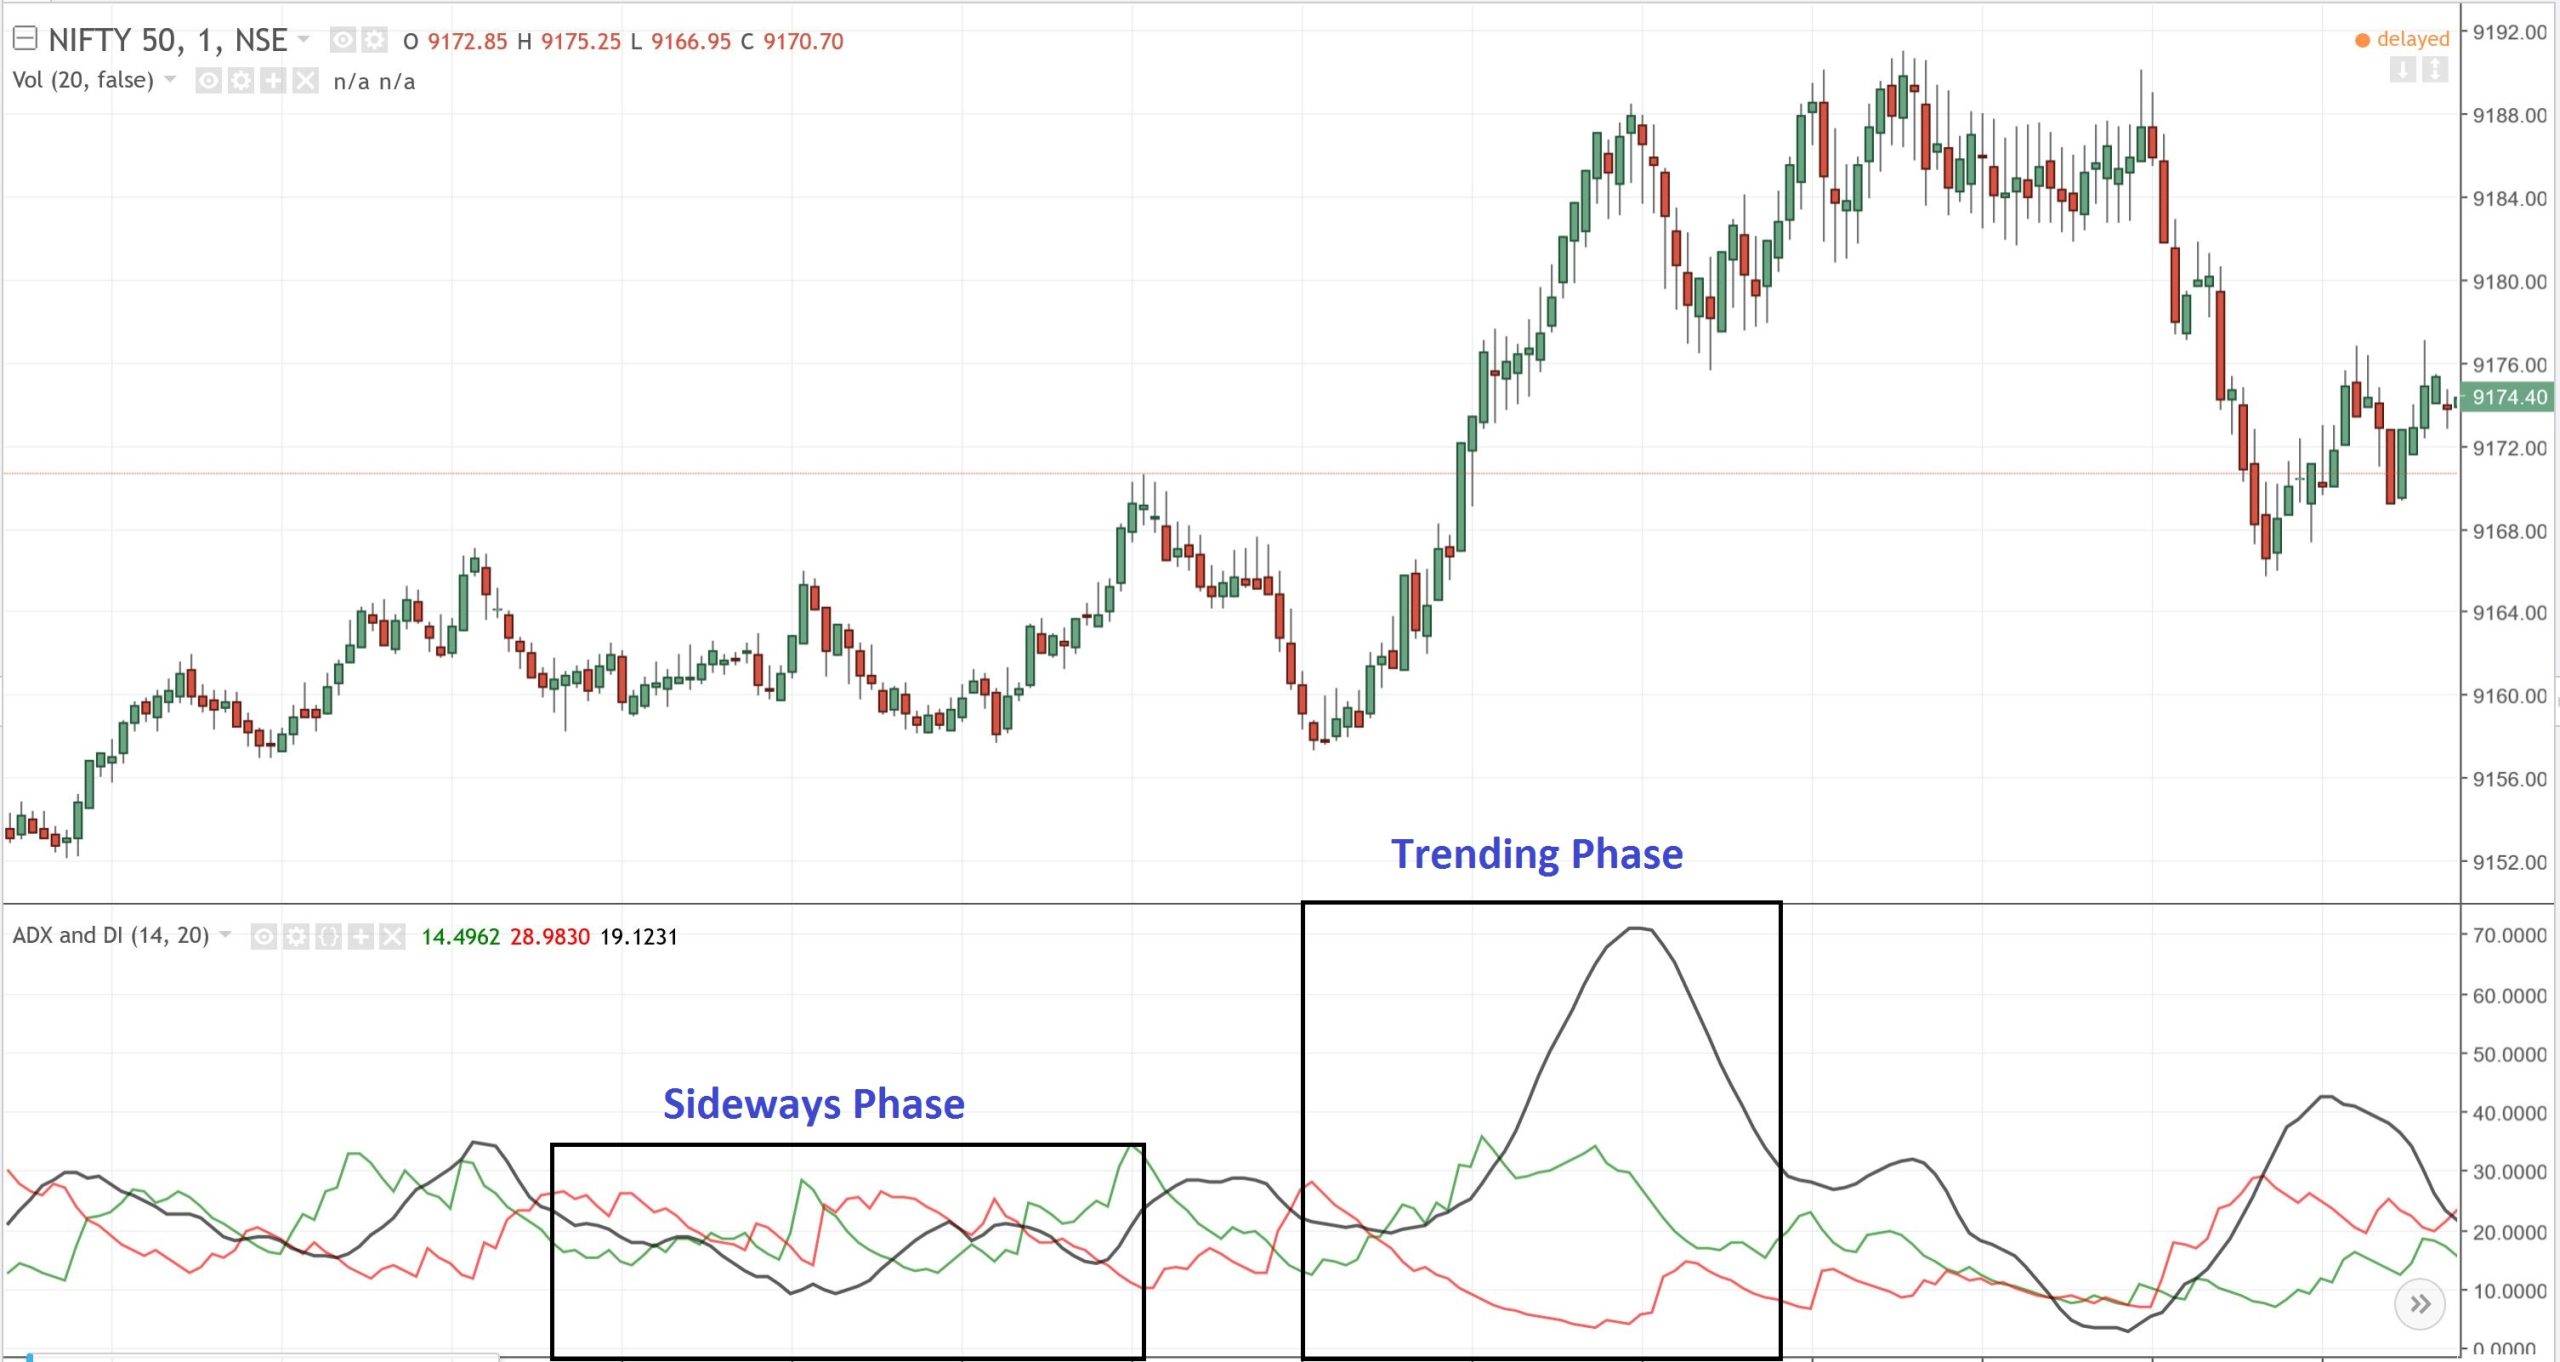
4. ADX – Measuring Trend Strength
The Average Directional Index (ADX) helps traders determine the strength of a trend. It ranges from 0 to 100, with higher values indicating stronger trends. The ADX works best alongside other trend-following indicators, providing a clearer picture of the market direction.
Also Check: Why Open Interest Matters in Trading?
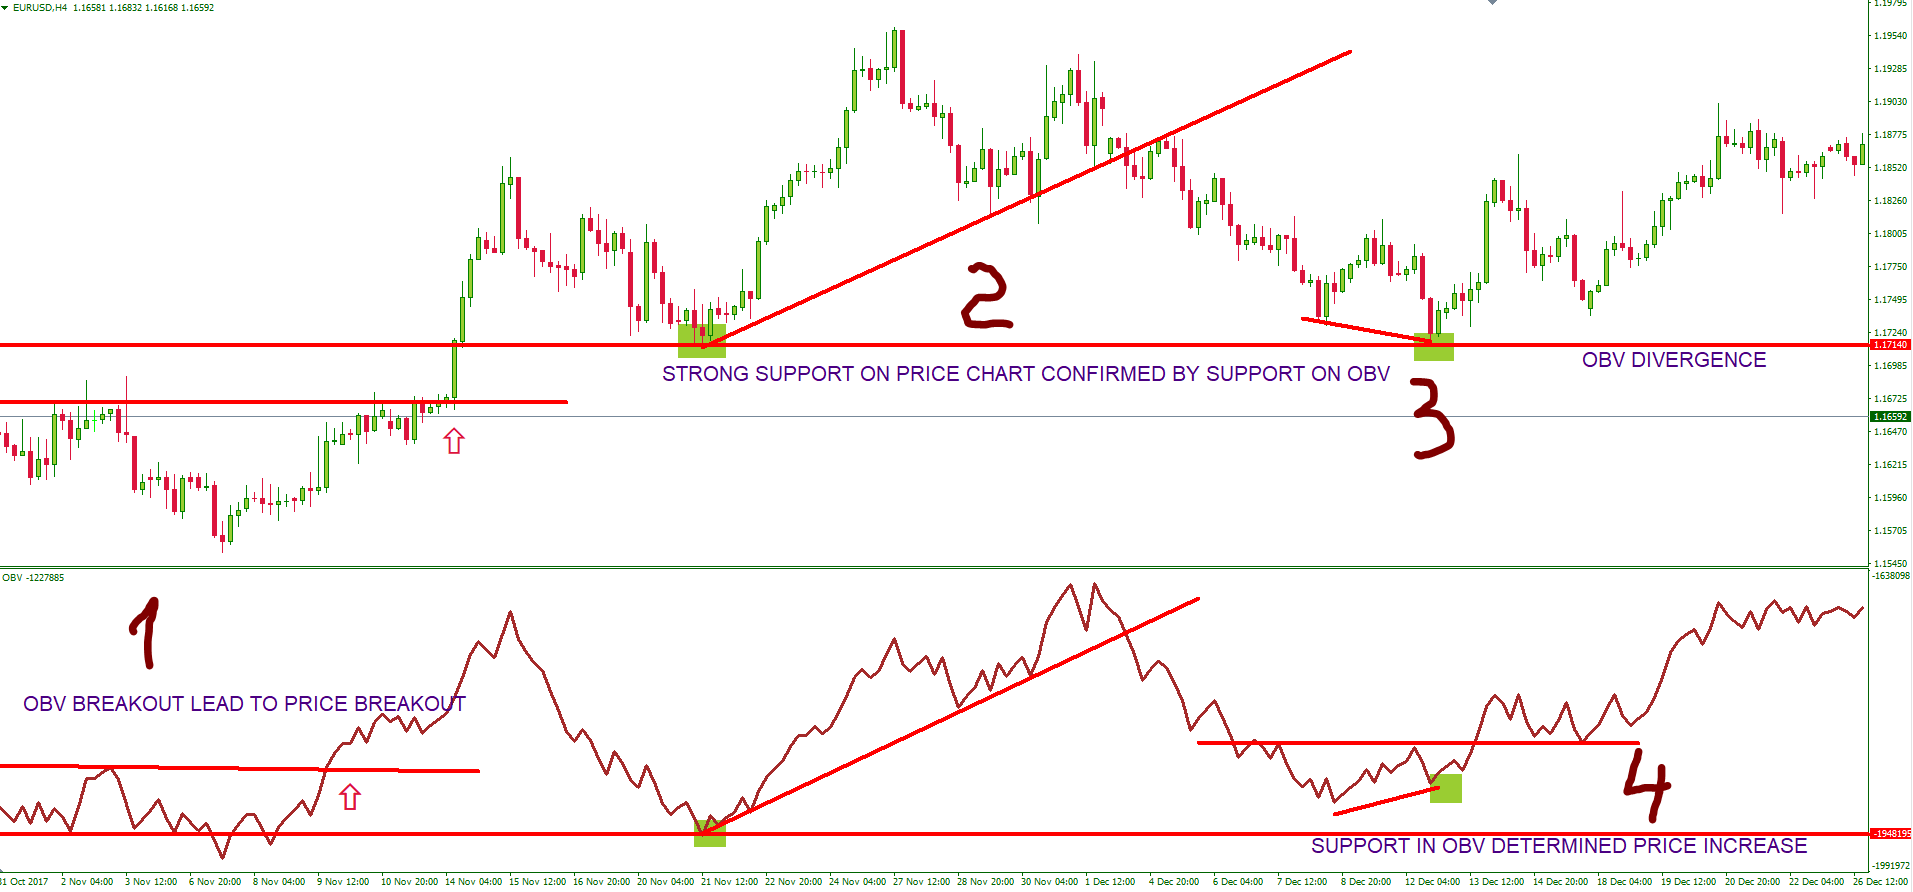
5. OBV – Tracking Volume Changes
The On Balance Volume (OBV) indicator is key for understanding momentum. It links volume changes to price movements, often predicting future price directions. OBV is effective in identifying the flow of ‘smart money’ in the market.
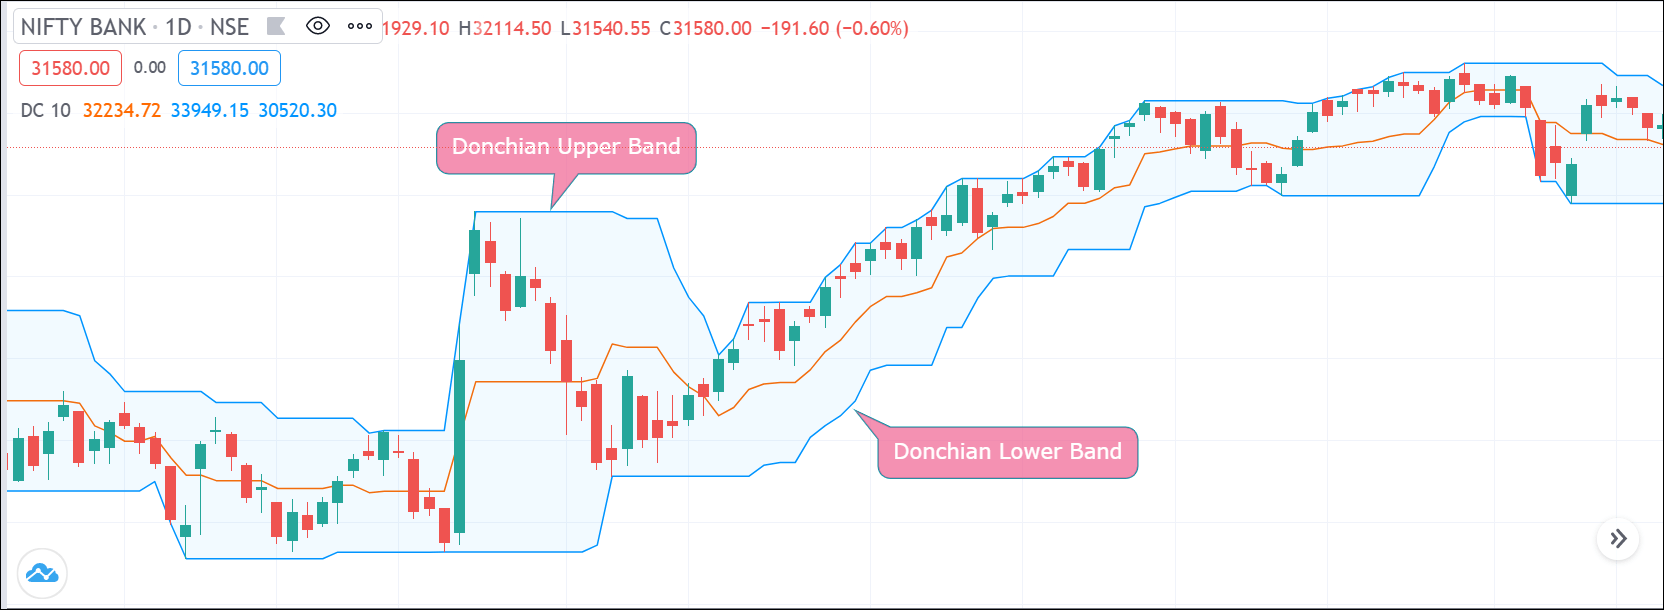
6. Donchian Channel – Spotting Market Breakouts
The Donchian Channel is a powerful indicator for both intraday and longer timeframes. It highlights market breakouts and volatility, making it a valuable tool for trend analysis.
Explore the Donchian channel strategy at this link
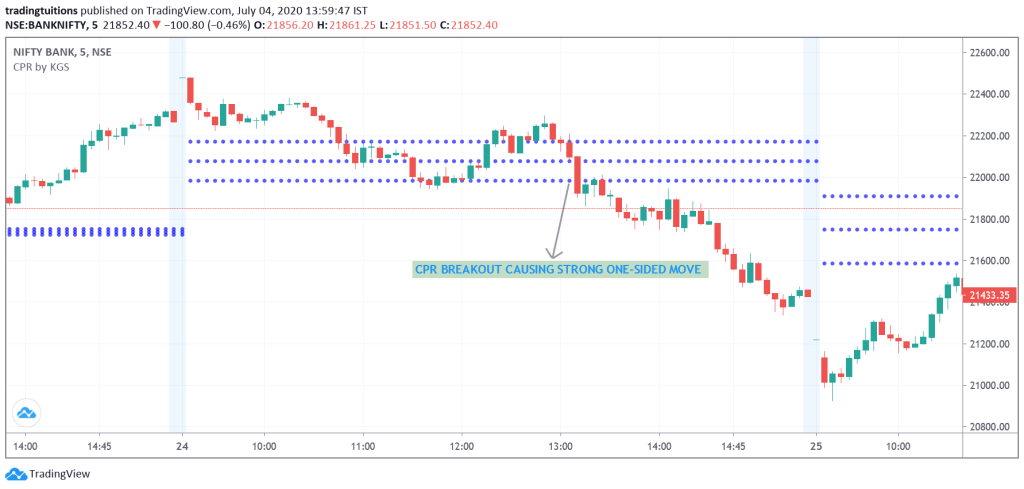
7. CPR – Versatile Trading Indicator
The Central Pivot Range (CPR) is a dynamic tool for day trading, offering key levels based on the previous day’s prices. These levels, constant throughout the day, guide traders on potential breakout points and support/resistance levels.
Deep dive into CPR with this guide: Mastering CPR Indicator Analysis in Technical Trading.
To conclude, these seven indicators are essential for successful intraday trading, applicable across various financial markets. Experiment with these tools individually, and don’t rely solely on one or wait for all to align before making a trade decision.

2 Comments