

The Weekly Breakout Trading Strategy is a dynamic approach in technical analysis, designed to capitalize on significant market movements following periods of consolidation. This strategy focuses on pinpointing critical price levels where a market breakout is likely, enabling traders to take long or short positions based on the direction of the breakout. This versatile strategy applies to various financial markets, such as stocks, commodities, and forex. In this article, we’ll explore the Weekly Breakout Trading Strategy Amibroker AFL Code, which is available for free download and can be imported into Amibroker.
Related Read: Ichimoku Cronex Taichi Indicator AFL Code
Amibroker AFL code for the Weekly Breakout Trading Strategy
					console.log( 'Code is Poetry' );//------------------------------------------------------
//
//  Formula Name:    Weekly Breakout Trading Strategy
//  Website:         https://zerobrokerageclub.com/
//------------------------------------------------------

_SECTION_BEGIN("Weekly Breakout Trading Strategy");

SetChartOptions(0,chartShowArrows|chartShowDates);
_N(Title = StrFormat("{{NAME}} – {{INTERVAL}} {{DATE}} Open %g, Hi %g, Lo %g, Close %g (%.1f%%) {{VALUES}}", O, H, L, C, SelectedValue( ROC( C, 1 ) ) ));

Plot( Close, "Price", colorWhite, styleCandle );

// Define Inputs
WeeksBack = Param("Weeks Back", 20, 1, 100, 1);
Threshold = Param("Threshold", 1, 0.1, 10, 0.1);

// Define Variables
PrevHigh = Ref(HHV(H, WeeksBack), -1);
PrevLow = Ref(LLV(L, WeeksBack), -1);


// Calculate Breakout Levels
BreakoutLong = PrevHigh + Threshold * (PrevHigh - PrevLow);
BreakoutShort = PrevLow - Threshold * (PrevHigh - PrevLow);

// Define Trading Signals
BuySignal = C > BreakoutLong;
SellSignal = C < BreakoutShort;

// Plot Breakout Levels
Plot(PrevHigh, "Previous High", colorGreen, styleLine);
Plot(PrevLow, "Previous Low", colorRed, styleLine);
Plot(BreakoutLong, "Long Breakout", colorBlue, styleLine);
Plot(BreakoutShort, "Short Breakout", colorBlue, styleLine);

// Plot Buy/Sell Signals
PlotShapes(IIf(BuySignal, shapeUpArrow, shapeNone), colorGreen, 0, Low);
PlotShapes(IIf(SellSignal, shapeDownArrow, shapeNone), colorRed, 0, High);

// Apply Trading Signals
Buy = BuySignal;
Sell = SellSignal;

_SECTION_END();
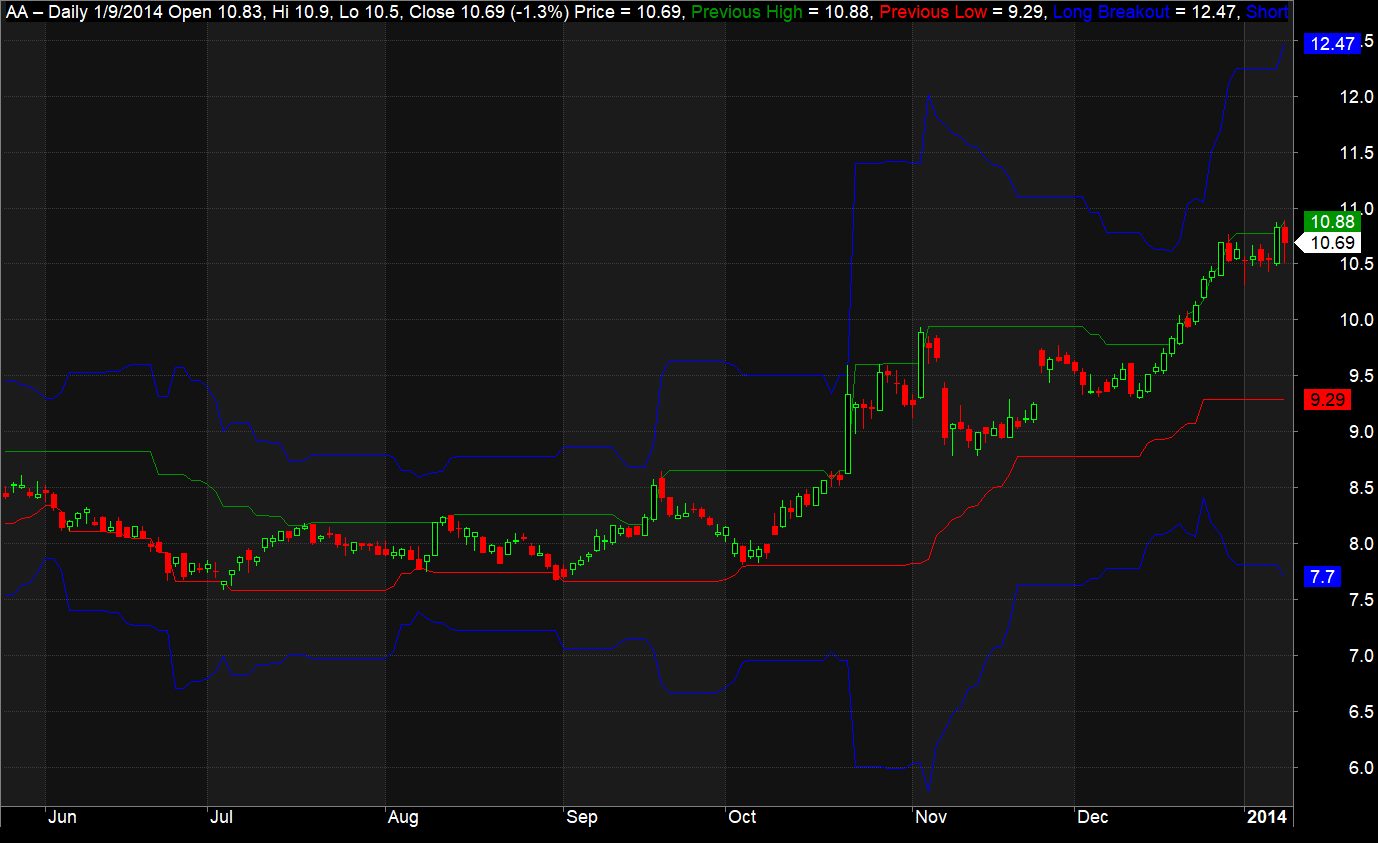
Visual Guide: Amibroker AFL for Weekly Breakout Trading Strategy
Take a look at the AFL in action:
Decoding the AFL Code
Let’s break down the code, line by line:
The Param function sets up the strategy’s inputs: WeeksBack determines the number of weeks for identifying previous highs and lows, and Threshold defines the percentage distance from these points to establish breakout levels.
					// Define Inputs
WeeksBack = Param("Weeks Back", 20, 1, 100, 1);
Threshold = Param("Threshold", 1, 0.1, 10, 0.1);
Ref function retrieves past data points. HHV and LLV find the highest and lowest values over the specified period, determining previous highs and lows.
					// Define Variables
PrevHigh = Ref(HHV(H, WeeksBack), -1);
PrevLow = Ref(LLV(L, WeeksBack), -1);
BreakoutLong and BreakoutShort using the previously identified highs and lows, modified by the Threshold value. These represent the levels at which to initiate long or short trades.
					// Calculate Breakout Levels
BreakoutLong = PrevHigh + Threshold * (PrevHigh - PrevLow);
BreakoutShort = PrevLow - Threshold * (PrevHigh - PrevLow);
BuySignal activates when the closing price surpasses the BreakoutLong level, while SellSignal triggers when it falls below BreakoutShort.
					// Plot Breakout Levels
Plot(PrevHigh, "Previous High", colorGreen, styleLine);
Plot(PrevLow, "Previous Low", colorRed, styleLine);
Plot(BreakoutLong, "Long Breakout", colorBlue, styleLine);
Plot(BreakoutShort, "Short Breakout", colorBlue, styleLine);

// Plot Buy/Sell Signals
PlotShapes(IIf(BuySignal, shapeUpArrow, shapeNone), colorGreen, 0, Low);
PlotShapes(IIf(SellSignal, shapeDownArrow, shapeNone), colorRed, 0, High);

// Apply Trading Signals
Buy = BuySignal;
Sell = SellSignal;
- The initial four lines plot the previous highs and lows using the
Plotfunction, as well as the breakout levels for long and short positions. - Subsequent lines use
PlotShapesto visually represent buy or sell signals with up or down arrows on the chart. - The concluding lines set the conditions for executing trades based on the
BuySignalandSellSignalvariables.


One Comment