The K-Ratio is a statistical tool that judges the reliability of your return rates over a stretch of time. It takes into account not just the initial and final capital amounts but also the capital’s growth trajectory. This crucial metric is key to assessing any trading system’s efficacy and is often featured in the backtest reports of various renowned trading software.
In 1996, the esteemed statistician and derivatives expert Lars Kestner introduced the K-Ratio. His innovative concept made its debut in a piece titled “Measuring System Performance” for a finance magazine. At the time, there was a pronounced need for a method to accurately appraise returns and evaluate trading systems, and Kestner’s K-Ratio aptly filled that void.
How to Compute the K-Ratio
The K-Ratio’s numerator is responsible for gauging returns, whereas the denominator gauges risk. Therefore, a higher K-Ratio is indicative of a superior and robust trading system.
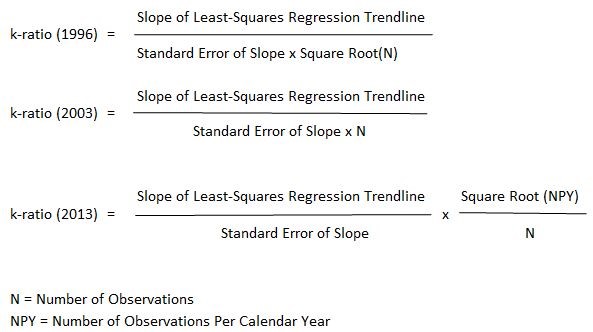
Speaking in statistical jargon, the numerator equates to the slope of the linear regression line plotted through a series of cumulative returns, and the denominator corresponds to the standard error of this regression line.

There have been three iterations of the K-Ratio formula to refine its precision. The following are these versions:

K-Ratio Excel Tool
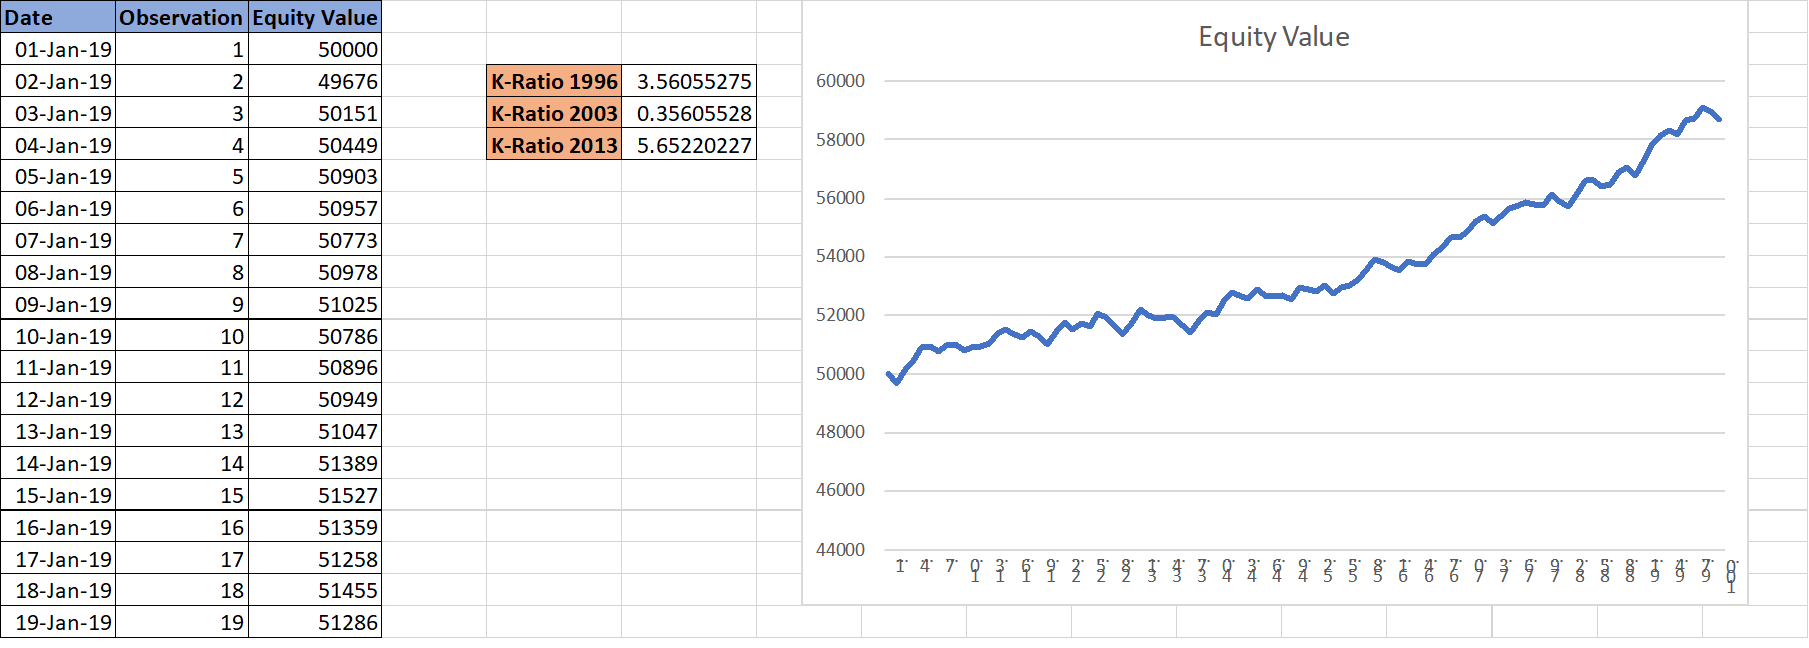
Our team has created an Excel template that effortlessly calculates the K-Ratio for your equity curve, which you can determine from your cumulative returns across a timeline.
This Excel template automatically computes all three versions of the K-Ratio. Your part is simply to input the equity values over your time series data.
Check out the screenshot of the Excel tool:
 You can download the Excel tool from here.
For those who use Amibroker software, you’ll find the 2003 version of the K-Ratio in its backtest report. Yet, regardless of which version you use, aim for a higher positive value to ensure your trading system is both stable and high-yielding.
As you craft your forthcoming trading system, keep an eye out for this straightforward but potent metric. It’s a singular ratio that can transparently signal the robustness of your system and the consistency of its returns.


One Comment