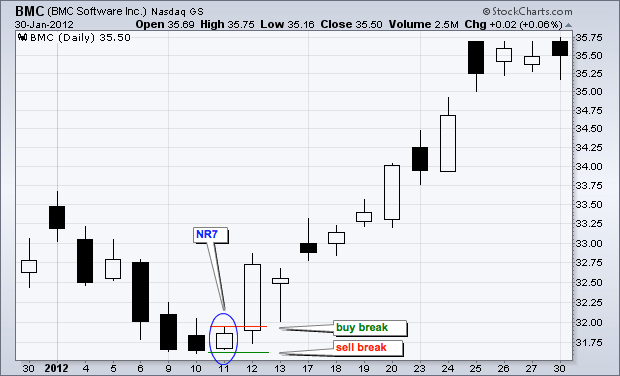
The NR7 Trading strategy, also known as Narrow Range Trading, is a breakout method. It assumes that a security’s price tends to move up or down after a short consolidation in a narrow price range. This strategy primarily looks back at a 7-day period, which means if the price range on a specific day is the lowest in the last 7 days, it’s referred to as an NR7 day. The range is calculated as the difference between the highest and lowest prices of that day. The following day serves as a confirmation of the expected price movement. A breakout above the high of the NR7 candle with significant trading volumes suggests bullishness, while a breakout below the low of the NR7 candle indicates bearishness.
The concept behind this pattern is similar to the Bollinger Band Squeeze, where a period of low volatility often precedes high volatility. Narrow range days signify price contractions that typically come before price expansions. Refer to the chart below for a visual representation:
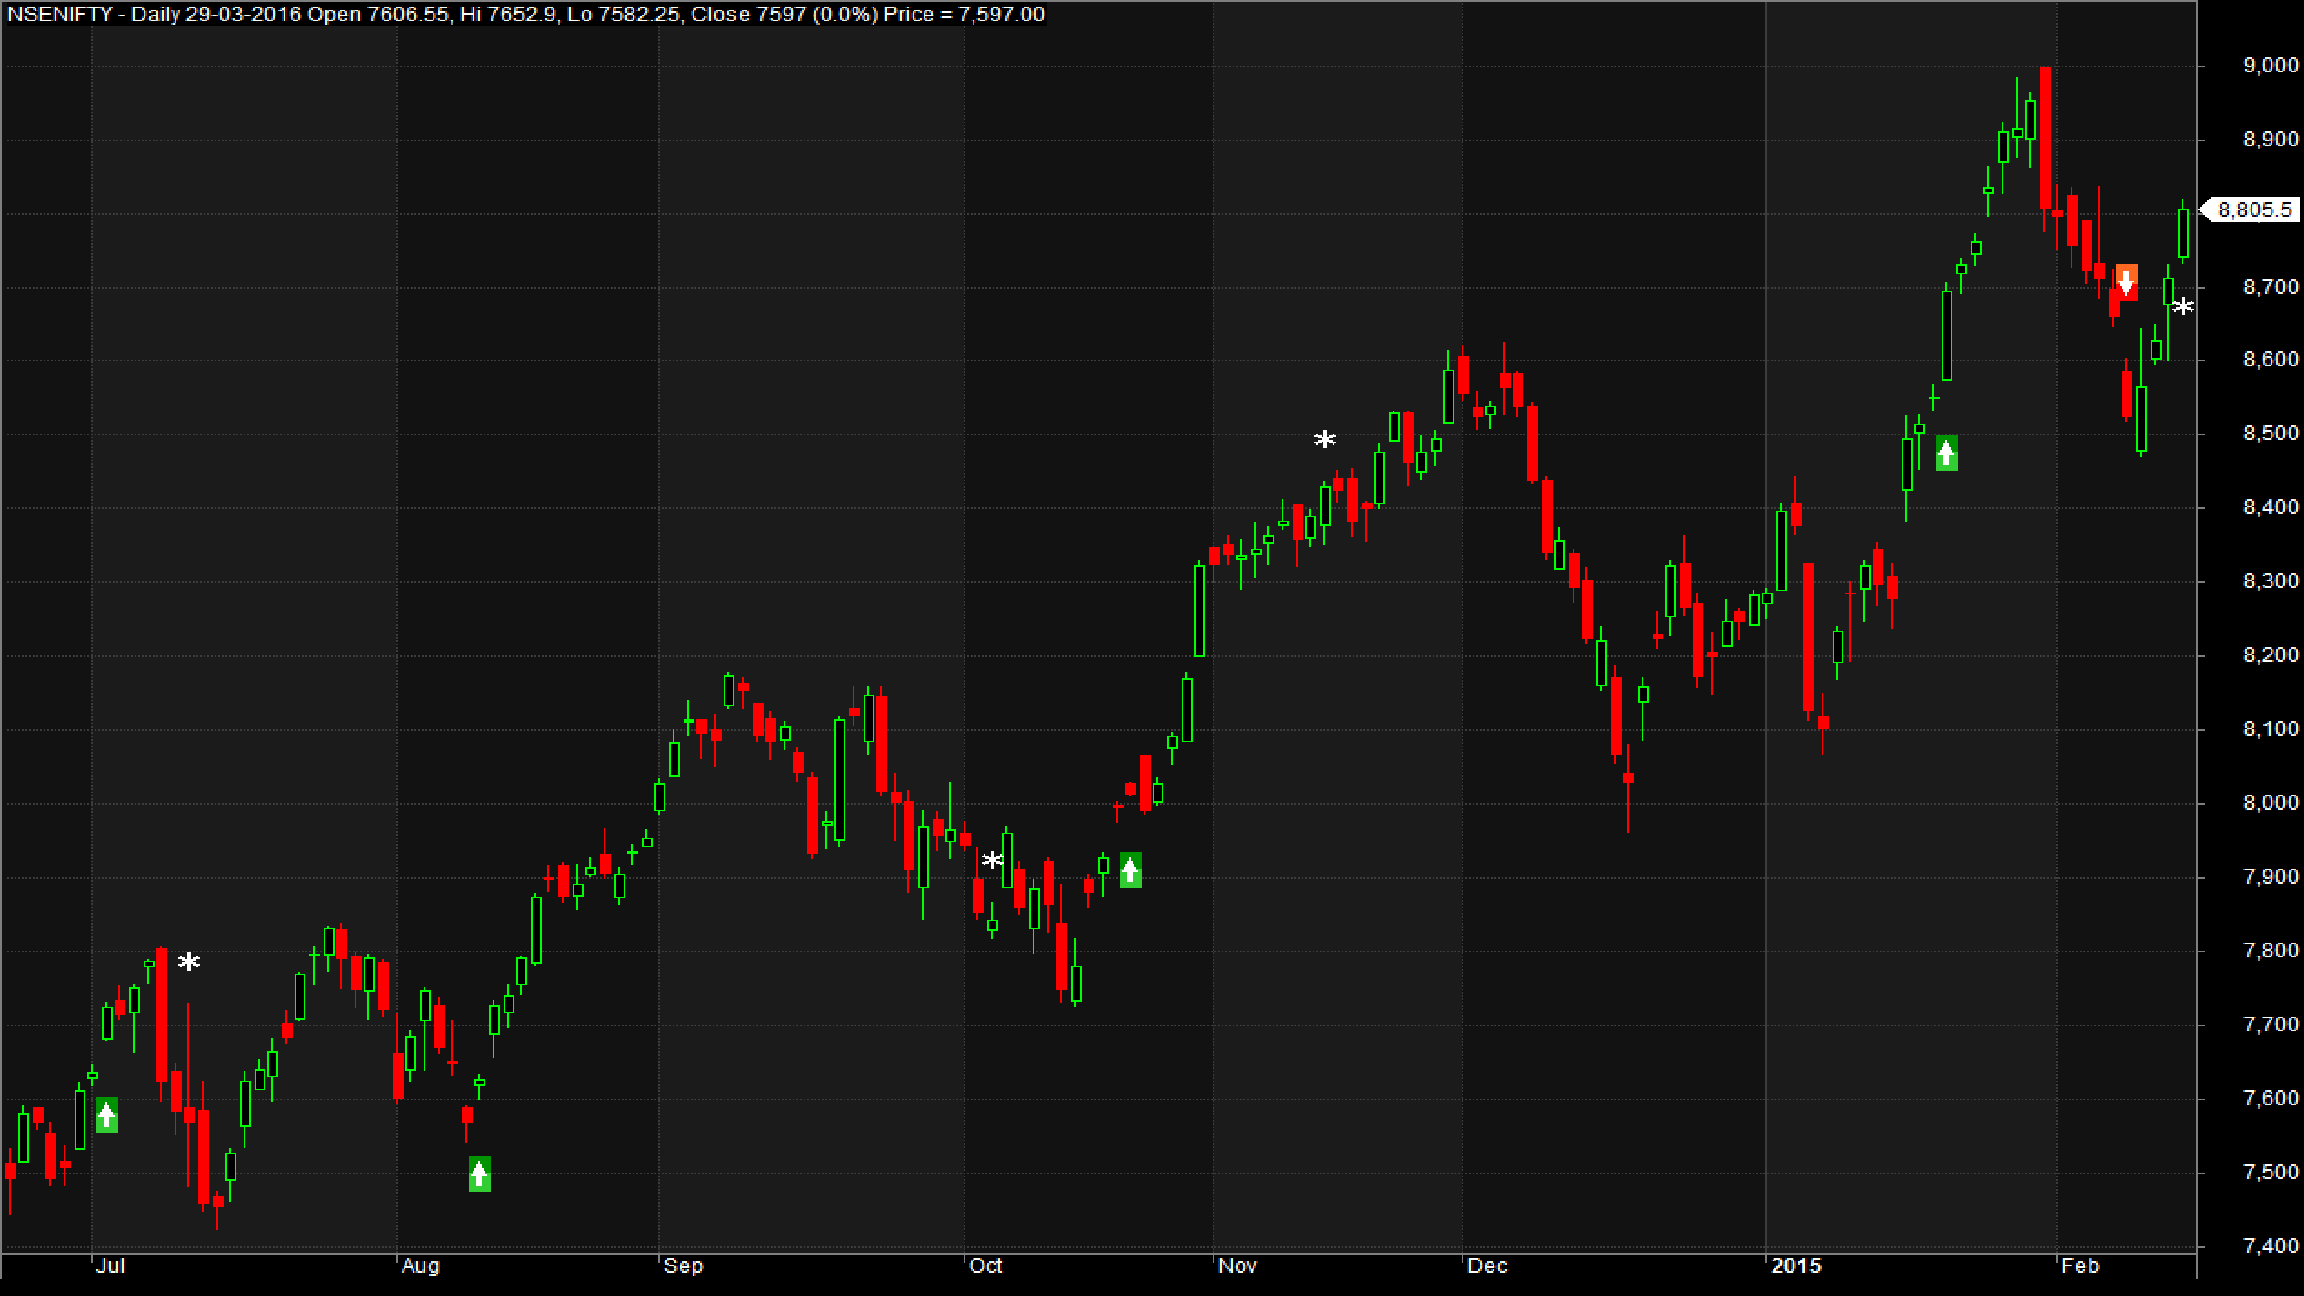
In the rest of this article, we will explore an Amibroker trading system based on the NR7 strategy. This approach has shown success, particularly in indexes like Nifty and Banknifty. It doesn’t generate a high number of trades throughout the year, but it tends to capture significant market movements. This is why we’ve named it the low-risk, high-reward strategy.
Click here to learn about AFL coding and create your own trading systems.
Overview of the NR7 Trading Strategy
| Parameter | Value |
| Preferred Timeframe | Daily |
| Indicators Used | None |
| Buy Condition | The previous candle is an NR7 candle, and the current candle has a Gap-Up opening. |
| Short Condition | The previous candle is an NR7 candle, and the current candle has a Gap-Down opening. |
| Sell Condition | Based on Target and Stop Loss |
| Cover Condition | Based on Target and Stop Loss |
| Stop Loss | 1% (fixed) |
| Targets | 4% (fixed) |
| Position Size | 50% of Equity |
| Initial Equity | 200,000 |
| Brokerage | 100 per order |
| Margin | 10% |
AFL Code
AFL Screenshot for the NR7 Trading Strategy
Backtest Report
Below is the backtest report for the NR7 Trading strategy, conducted on two major indices listed on NSE.
| Parameter | Value | |
| Nifty | Bank Nifty | |
| Initial Capital | 200,000 | 200,000 |
| Final Capital | 1,482,002.22 | 1,691,748.00 |
| Backtest Period | 01-Jan-2010 to 30-Sep-2016 | 01-Jan-2012 to 30-Sep-2016 |
| Net Profit % | 641.00% | 745.87% |
| Annual Return % | 34.59% | 56.79% |
| Number of Trades | 33 | 28 |
| Winning Trade % | 54.55% | 53.57% |
| Average Holding Period | 8.24 periods | 4.96 periods |
| Max Consecutive Losses | 4 | 3 |
| Max System % Drawdown | -25.83% | -18.52% |
| Max Trade % Drawdown | -34.61% | -31.09% |
For a more detailed backtest report, you can download it here.
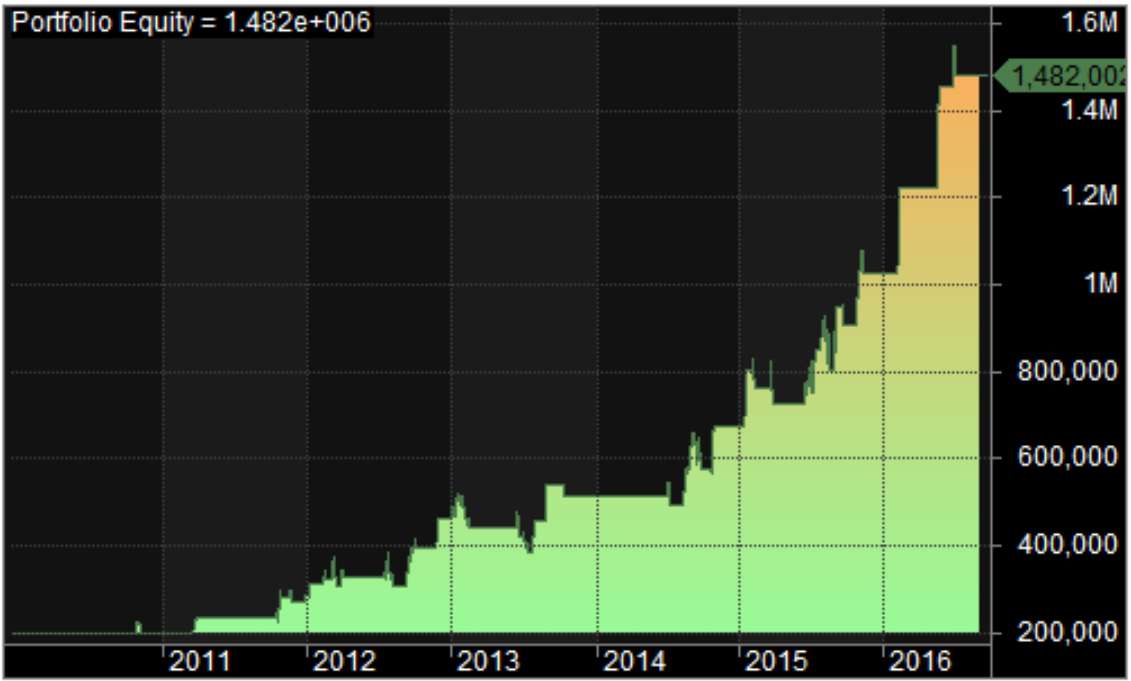
Equity Curve
The equity curve for the NR7 Trading strategy shows a linear progression.
Nifty:
Bank Nifty:

Additional Amibroker Settings for Backtesting
Go to Symbol–>Information and specify the lot size and margin requirement. In the screenshot below, you can see a lot size of 30 and a margin requirement of 10% for Bank Nifty: