

Enhancing Stock Market Success with Trend Analysis
One of the most effective strategies for long-term success in the stock market is identifying and riding market trends. The foundation of this approach rests on the assumption that trends persist over a substantial timeframe. However, manually sifting through numerous stocks to pinpoint the trending ones can be a daunting task. The Amibroker exploration AFL for Trending stocks screener is designed to simplify this process. It systematically scans through your entire stock database and assigns a trend score to each stock. A trend score exceeding 5 signals an upward trend, while a score below 2 indicates a downward trend. Scores ranging from 2 to 5 reflect a state of uncertainty, suggesting caution when considering these stocks.
If you’re interested in learning AFL coding and crafting your trading systems, you can click here to explore more.
A Detailed Look at the Trending Stocks Screener – AFL
| Parameter | Value |
| Preferred Time-frame | Daily |
| Indicators Used | Simple Moving Average, Bollinger Bands, MACD, Aroon Indicator, Stochastic Indicator, RSI, MFI |
| Conditions Indicative of a Bullish Trend |
|
| Conditions Indicative of a Bearish Trend |
|
| Trend Score Calculation | The initial Trend Score is zero. One point is added for each met Bullish condition. If no Bullish conditions are met, the Trend score remains at 0. A score of 7 indicates that all Bullish conditions are met. |
Trending Stocks Screener – AFL Code
					//------------------------------------------------------
//
//  Formula Name:    Trending Stocks Screener
//  Website:         https://zerobrokerageclub.com/
//------------------------------------------------------

_SECTION_BEGIN("Trending Stocks Screener");
i=0;
//52 Week High Low
High52 = HHV(High,250);
Low52 = LLV(Low,250);

//Bollinger Band
BB1=C>BBandTop(C,20,2) AND Ref(C,-1)<Ref(BBandTop(C,20,2),-1);
BB2=C<BBandBot(C,20,2) AND Ref(C,-1)>Ref(BBandBot(C,20,2),-1);
BBStatus=WriteIf(BB1,"Above Top",WriteIf(BB2,"Below Bottom",WriteIf(IsNull(MA(C,20)),"N/A","Neutral")));
BBColor=IIf(BB1,colorRed,IIf(BB2,colorGreen,colorLightGrey));
IIf(BB2,i+1,i);

//Moving Average (Short, Mid & Long Term)
MAShort = C>MA(C,15);
IIf(MAShort,i+1,i);
MAMid = C>MA(C,45);
IIf(MAMid,i+1,i);
MALong = C>MA(C,100);
IIf(MALong,i+1,i);
ShortStatus = WriteIf(MAShort,"Bullish",WriteIf(IsNull(MA(C,15)) ,"N/A","Bearish"));
ShortColor = IIf(MAShort,colorGreen,colorRed);
MidStatus = WriteIf(MAMid,"Bullish",WriteIf(IsNull(MA(C,45))," N/A","Bearish"));
MidColor = IIf(MAMid,colorGreen,colorRed);
LongStatus = WriteIf(MALong,"Bullish",WriteIf(IsNull(MA(C,100)) ,"N/A","Bearish"));
LongColor = IIf(MALong,colorGreen,colorRed);

//MACD
MACDBull=MACD(12,26)>Signal(12,26,9);
IIf(MACDBull,i+1,i);
MACDStatus=WriteIf(MACDBull,"Bullish",WriteIf(IsNull(MACD(12,26)),"N/A","Bearish"));
MACDColor=IIf(MACDBull,colorGreen,colorRed);

//Aroon
Period=14;
LLVBarsSince=LLVBars(L,Period)+1;
HHVBarsSince=HHVBars(H,Period)+1;
AroonDown=100*(Period-LLVBarsSince)/(Period-1);
AroonUp=100*(Period-HHVBarsSince)/(Period-1);
AroonOsc=AroonUp-AroonDown;
Aroon=AroonOsc>0;
IIf(Aroon,i+1,i);
AroonStatus=WriteIf(Aroon,"Bullish",WriteIf(IsNull (RSI(14)),"N/A","Bearish"));
AroonColor=IIf(Aroon,colorGreen,IIf(IsNull(RSI(14) ),colorLightGrey,colorRed));

//Stochastic
StochKBull=StochK(14,3)>StochD(14,3,3);
IIf(StochKBull,i+1,i);
StochKStatus=WriteIf(StochKBull,"Bullish",WriteIf( IsNull(StochK(14,3)),"N/A","Bearish"));
StochKColor=IIf(StochKBull,colorGreen,colorRed);

//RSI
R1=RSI(14)>30 AND Ref(RSI(14),-1)<30 AND Ref(RSI(14),-2)<30;
R2=RSI(14)<70 AND Ref(RSI(14),-1)>70 AND Ref(RSI(14),-2)>70;
IIf(R1,i+1,i);
RSIStatus=WriteIf(R1,"Improving",WriteIf(R2,"Decli ning",WriteIf(IsNull(RSI(14)),"N/A","Neutral")));
RSIColor=IIf(R1,colorGreen,IIf(R2,colorRed,colorLightGrey));

//MFI
M1=MFI(14)>80;
M2=MFI(14)<20;
IIf(M2,i+1,i);
MFIStatus=WriteIf(M1,"Overbought",WriteIf(M2,"Over sold",WriteIf(IsNull(MFI(14)),"N/A","Neutral")));
MFIColor=IIf(M1,colorRed,IIf(M2,colorGreen,colorLightGrey));


 TrendScore =

 IIf(BB2,1,0)+
 IIf(MAShort,1,0)+
 IIf(MAMid,1,0) +
 IIf(MAMid,1,0) +
 IIf(MALong,1,0)+
 IIf(MACDBull,1,0) +
 IIf(Aroon,1,0) +
 IIf(StochKBull,1,0)+
 IIf(R1,1,0) +
 IIf(M2,1,0) ;


Filter = 1;

//AddColumn(High52,"52 Week High");
//AddColumn(Low52,"52 Week Low");
AddColumn(C,"Close",1,IIf(C>Ref(C,-1),colorGreen,colorRed));
AddColumn(V,"Volume",1,IIf(V>Ref(V,-1),colorGreen,colorRed));
AddTextColumn(BBStatus,"BBand",1,colorWhite,BBColor);
AddTextColumn(ShortStatus,"Short MA(15)",1,colorWhite,ShortColor);
AddTextColumn(MidStatus,"Mid MA(45)",1,colorWhite,MidColor);
AddTextColumn(LongStatus,"Long MA(100)",1,colorWhite,LongColor);
AddTextColumn(MACDStatus,"MACD",1,colorWhite,MACDColor);
AddTextColumn(AroonStatus,"Aroon",1,colorWhite,AroonColor);
AddTextColumn(StochKStatus,"Stochastic",1,colorWhite,StochKColor);
AddTextColumn(RSIStatus,"RSI(14)",1,colorWhite,RSIColor);
AddTextColumn(MFIStatus,"MFI(14)",1,colorWhite,MFIColor);
AddColumn(TrendScore,"Score");
_SECTION_END();
Exploration Screenshot
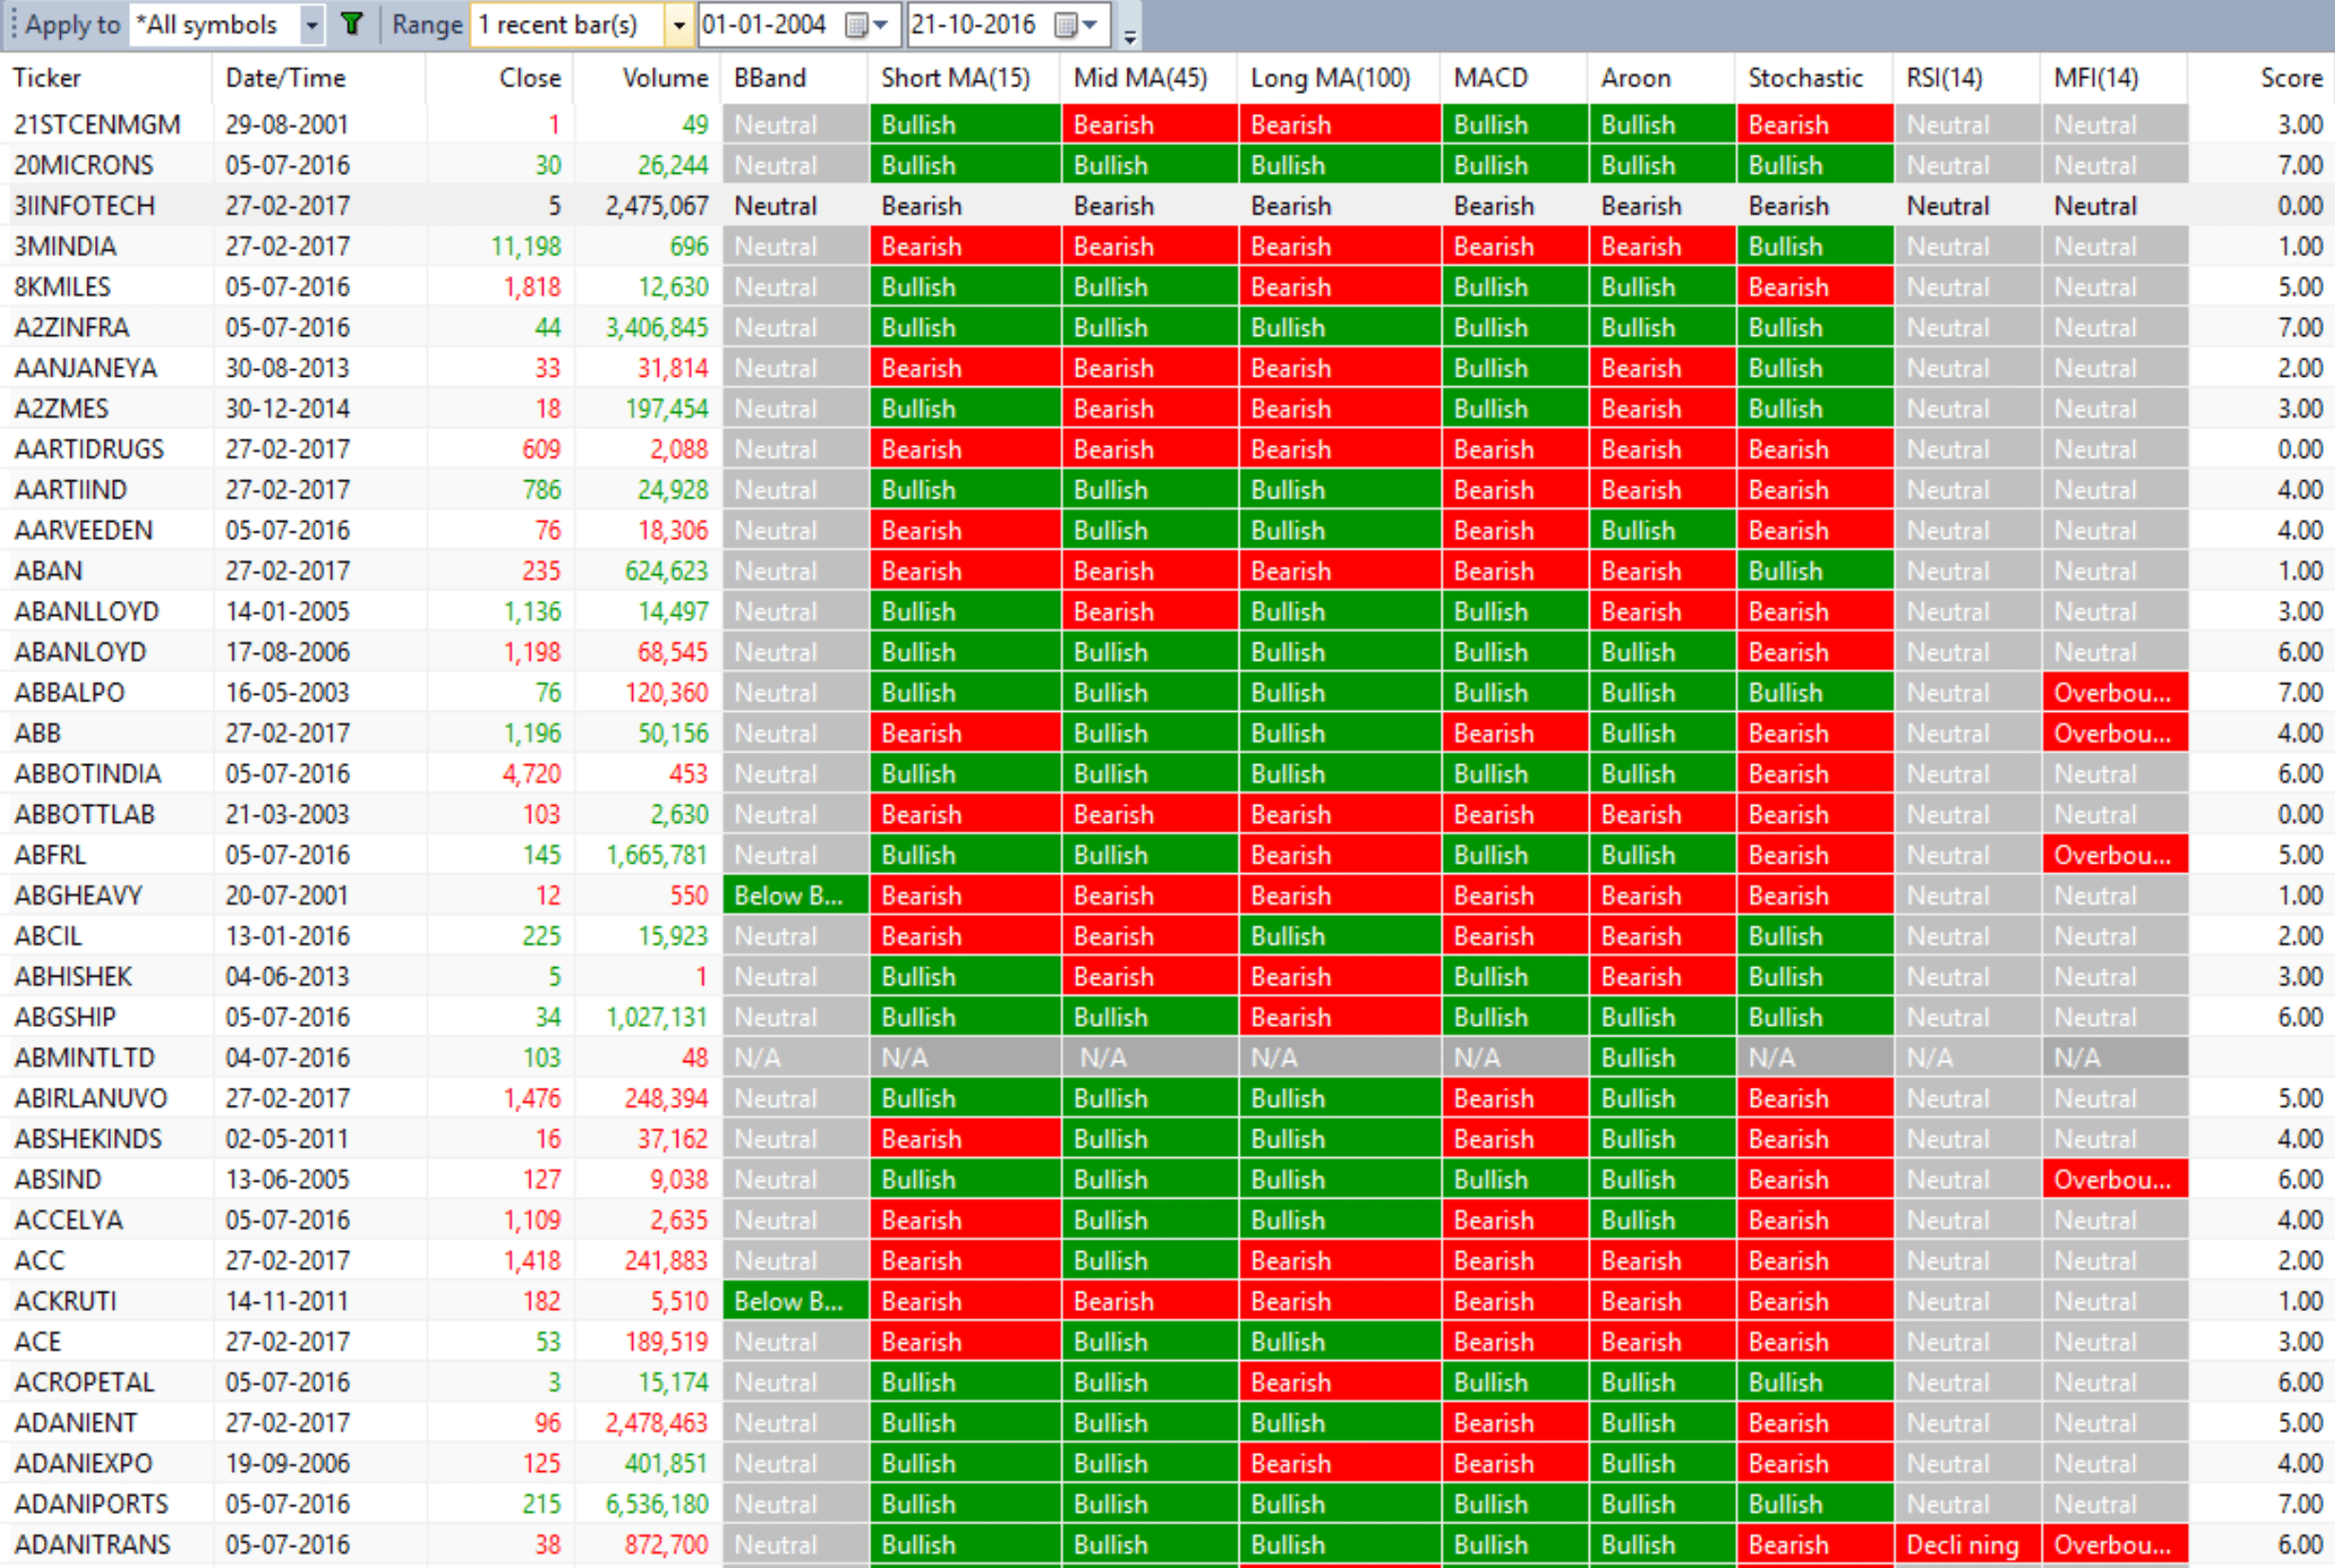
How to Utilize the Trending Stocks Screener
Step 1: Begin by copying the provided AFL code and configuring it within your local Amibroker.
Step 2: Download and set up end-of-day (EOD) data for your preferred exchange.
Step 3: Access the ‘Analysis’ menu and select ‘Explore.’ In the range drop-down menu, opt for ‘1 recent bar.’
Step 4: In the results, you’ll find the Trend score for each scrip. A score greater than 5 indicates bullish stocks, while a score less than 2 suggests bearish stocks.


One Comment