Aroon Indicator: The term “Aroon” originates from Sanskrit, meaning ‘Dawn’s Early Light.’ Developed by Tushar Chande, author of ‘Beyond Technical Analysis,’ this indicator detects the onset of a new trend, be it an uptrend or downtrend. Unlike most indicators relying on price or volume, Aroon Indicator is time-based. It calculates Aroon based on the number of periods since the last X days’ high or low. Aroon Up measures the number of periods from the X days’ high as a percentage, while Aroon Down measures the number of periods from the X days’ low. Traders frequently use it alongside other indicators for trend identification.
Calculating Aroon Indicator
To calculate Aroon Up and Aroon Down indicators, use the following formula:
Aroon Up = ((X – Days Since X-day High)/X) x 100
Aroon Down = ((X – Days Since X-day Low)/X) x 100
The default value for X is 25 periods, with Aroon Up and Down values ranging from 0 to 100. Higher Aroon values signify recent highs and lows, while lower values suggest less recent highs and lows.
Interpreting Aroon Indicator
Below is a chart featuring the Aroon Indicator:
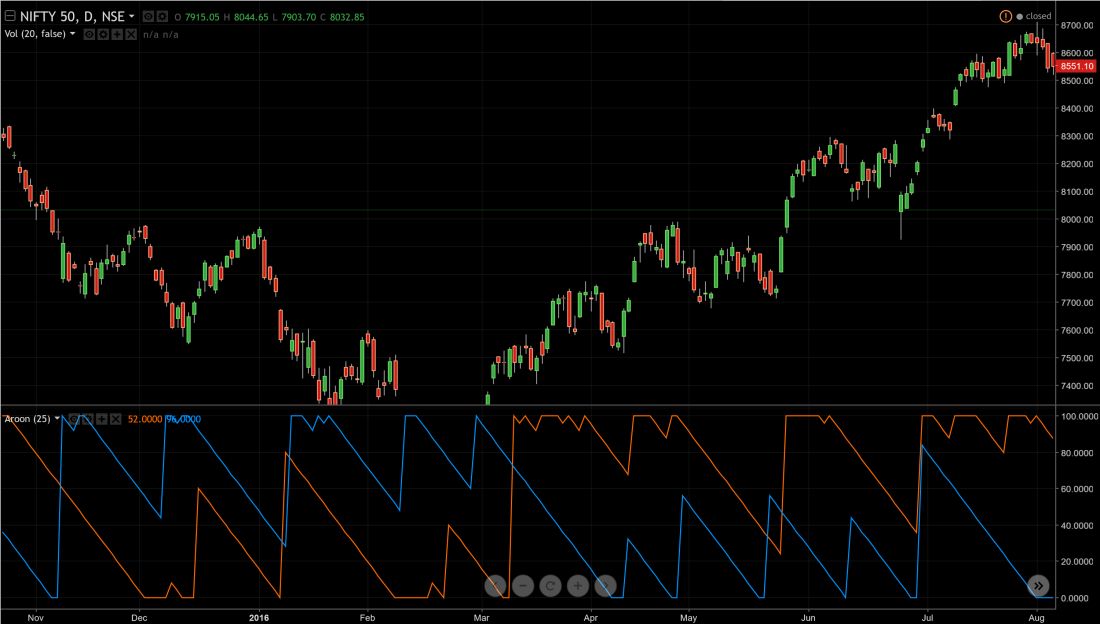
The Red line represents Aroon Up, while the Blue line represents Aroon Down.
Interpreting Aroon is straightforward:
- When a bearish trend turns bullish, Aroon Up crosses above Aroon Down. The reverse is true for a transition from bullish to bearish.
- In strong trends, the Aroon Indicator displays extreme readings, nearing 100.
- During sideways movements, Aroon Up and Aroon Down lines run parallel to each other.
- A reading above 70 indicates a robust trend, while a reading below 30 suggests weak trend strength. Readings between 30 and 70 indicate indecision. For example, if the bullish indicator remains above 70 while the bearish indicator remains below 30, the trend is decidedly bullish.
Using Aroon Indicator in Different Markets
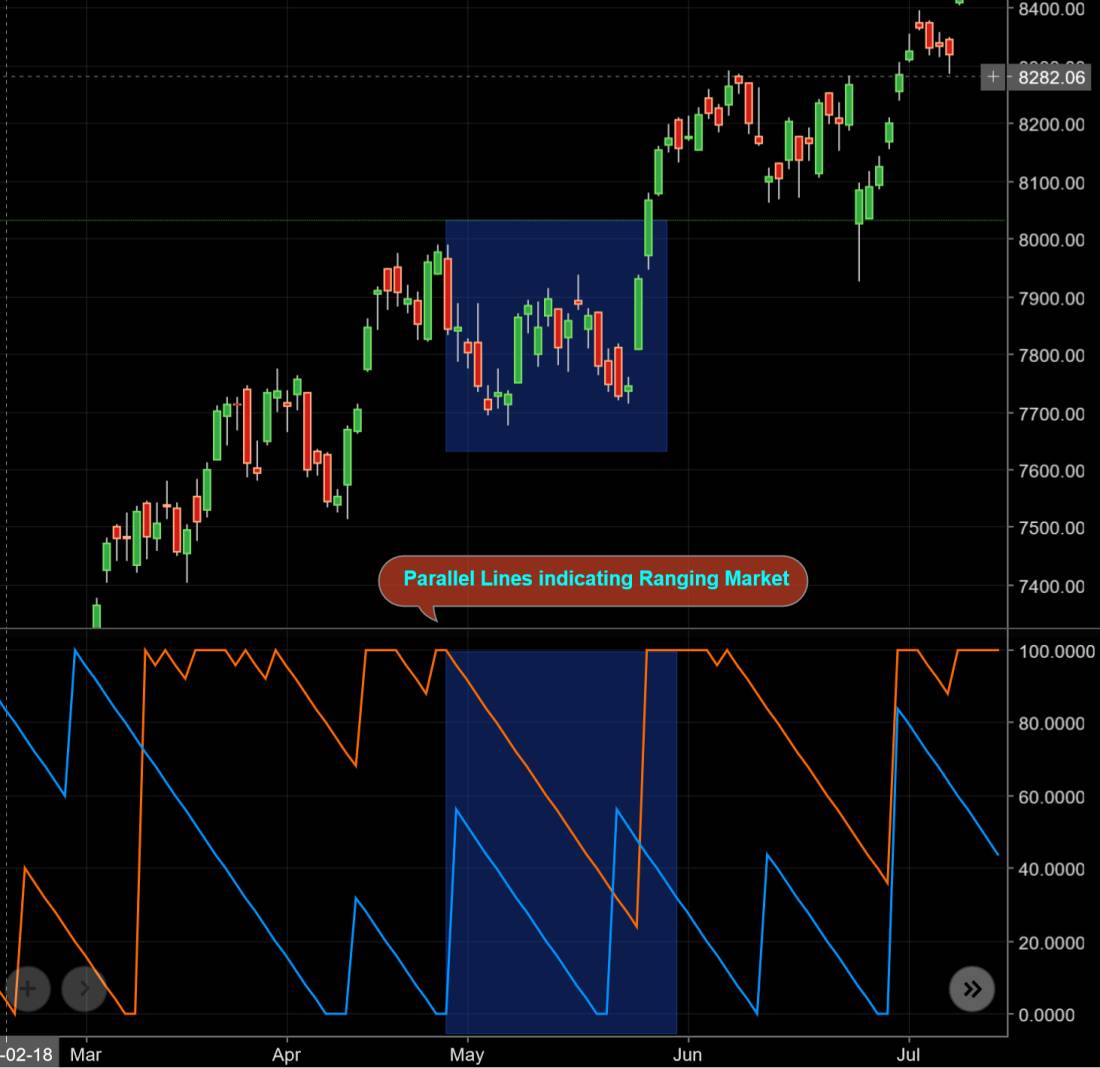
The Aroon Indicator’s versatility shines in both trending and ranging markets. Crossovers of Aroon Up and Down, along with extreme readings, signal strong trends. When Aroon Up and Down indicators run parallel, it suggests a ranging market.
For trend traders, crossovers can trigger trades:
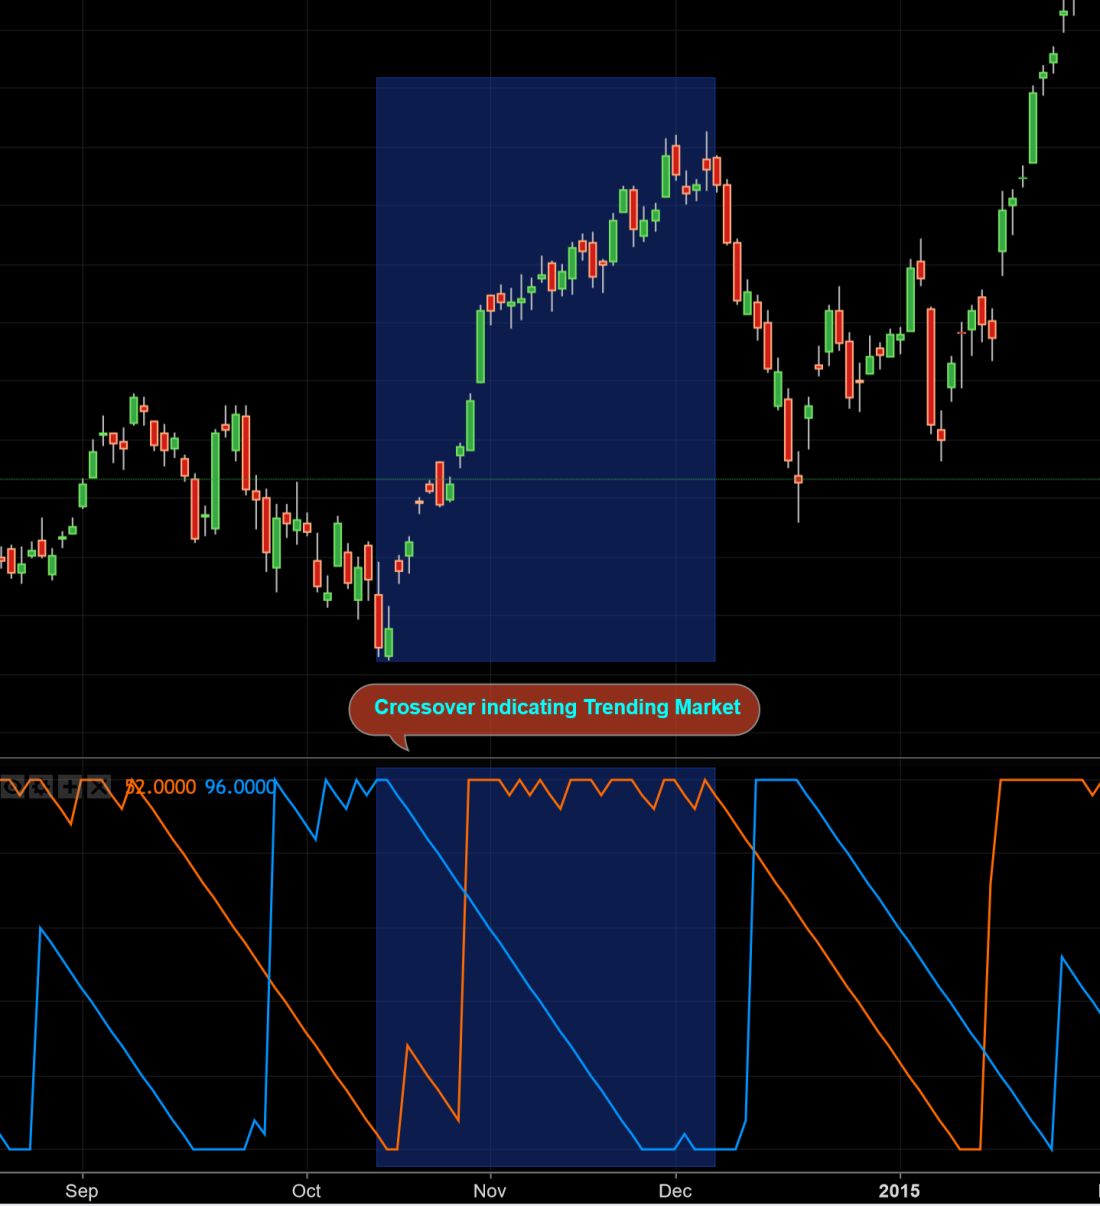
If you prefer range trading, you can identify potential ranges through parallel lines, enabling you to Buy low and Sell high:
Filtering False Signals with Aroon Indicator
Similar to other indicators, Aroon may occasionally produce false signals. To mitigate this, consider using the Exponential Moving Average (EMA) indicator. If a stock is trading above the X days EMA and Aroon signals a Buy, it can be a reliable trade. The EMA’s length can be determined through optimization based on historical data.
Conclusion
The Aroon Indicator excels at identifying trends early, making it a valuable tool for day trading strategies. While it shouldn’t be used in isolation, when combined with other indicators, it can significantly improve your success rate in both trend trading and ranging market scenarios.