Explore the Power of Google Finance
Google Finance is a powerful and free tool provided by Google, used by millions of traders and investors worldwide. It offers various capabilities, all at no cost, making tasks like managing your portfolio, accessing stock quotes from global exchanges, and creating custom stock screeners more convenient. Although Google Finance APIs that were available in the past are now deprecated, you can still use Google Finance data in Google Sheets or Docs. In this article, we will guide you on how to utilize Google Finance for informed trading decisions and introduce you to some of its remarkable features.
Google Finance Stock Screener: Unleash Its Potential
One of Google Finance’s lesser-known features is the Stock Screener, a powerful tool that many users tend to overlook. This tool allows you to retrieve a list of stocks from any exchange based on your specified criteria. While most filters in the screener focus on fundamental factors, there are also technical aspects to consider. You can access the stock screener here.
Here’s what it looks like:
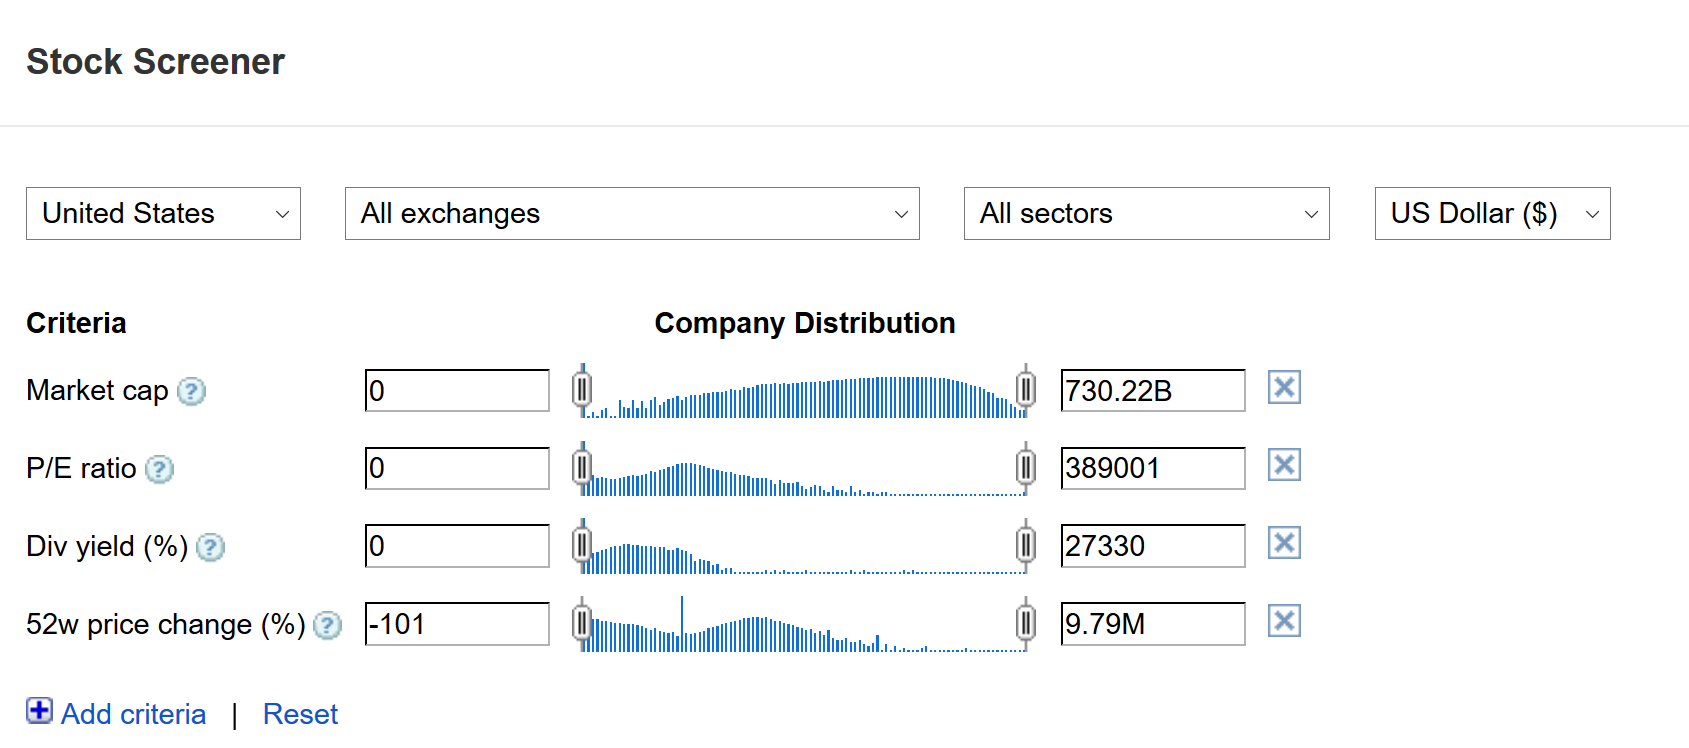
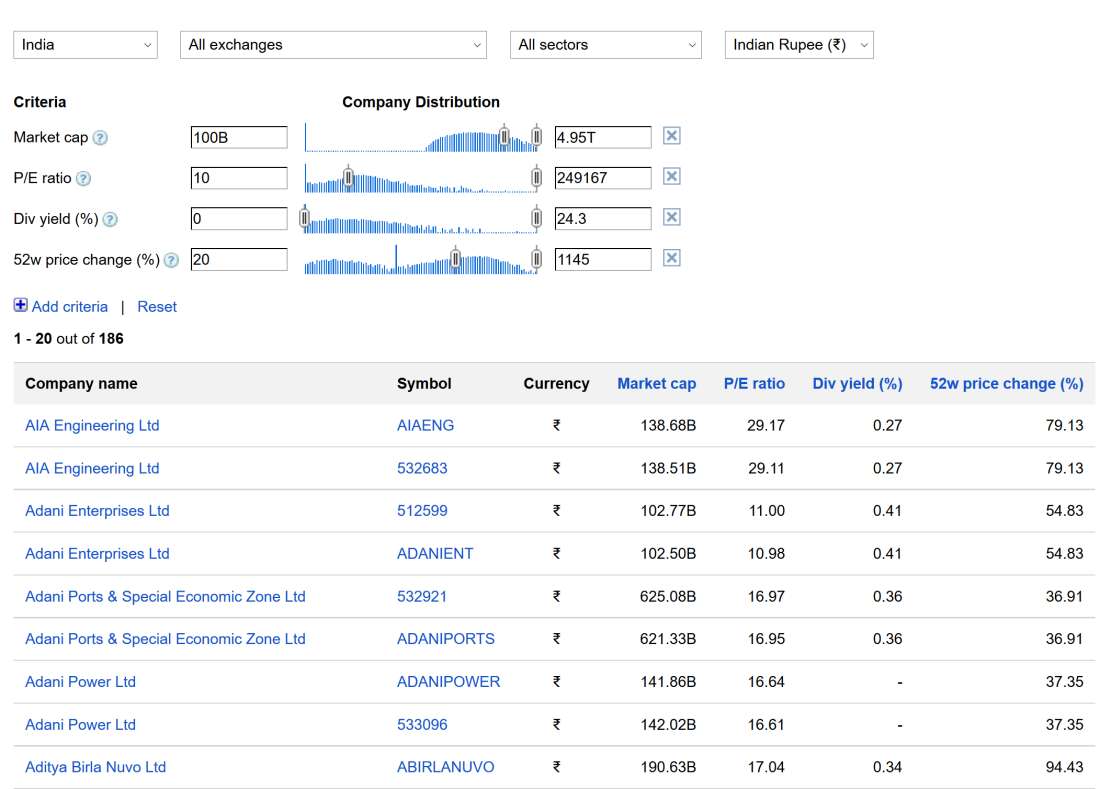
In the top section, you can specify the Country, Exchange, Sector, and Currency. In the lower section, you can define your screener criteria. Click the ‘Add Criteria’ button to explore more options. In the screenshot below, I’ve configured the criteria to filter Indian stocks with a 52-week price change greater than 20%, a minimum P/E ratio of 10, and a market capitalization exceeding 100 billion.
Discover Domestic Trends with Google Finance
Google Finance offers a unique feature called Domestic Trends, which provides insights into the popularity and trends of specific keywords. According to Google, “Google Domestic Trends track Google search traffic across specific sectors of the economy. Changes in the search volume of a given sector on google.com may provide unique economic insight. You can access individual trend indexes by clicking on the left-hand navigation.”
An in-depth analysis of trends for a particular sector can help you identify patterns and make profitable trading decisions. It’s important to note that trend data is calculated using Google US traffic statistics.
To access Google Domestic Trends, visit the following URL: https://www.google.com/finance/domestic_trends. On the left side of the screen, you’ll find a list of sectors. Click on a particular sector to view its trend represented as a graph. The screenshot below illustrates the trend for the ‘Computers and Electronics’ sector.
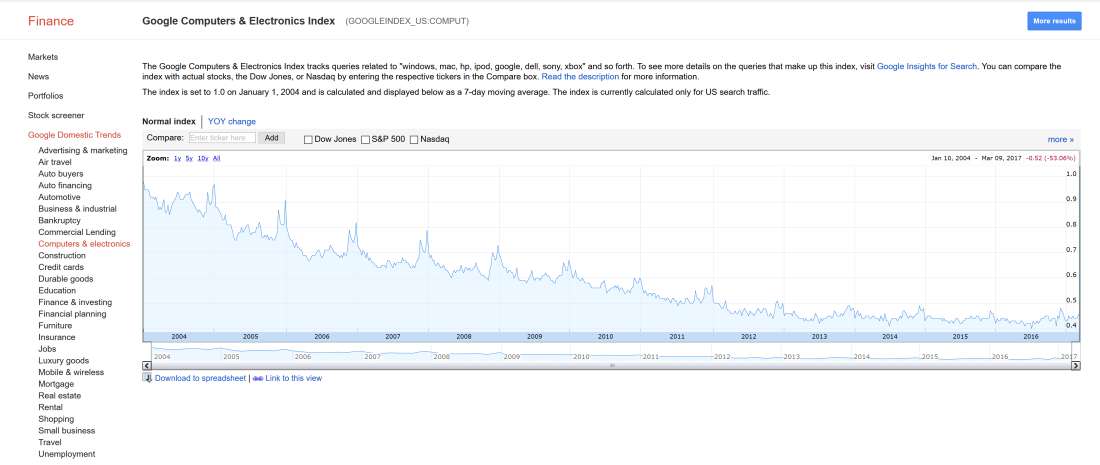
A quick look at the graph shows that the trend for this sector has been steadily declining over the last 10-12 years. This decline suggests that the IT industry is no longer as booming as it used to be. Google Finance measures the search volume of keywords relative to all other searches on Google. This means that an increase or decrease in the relative search volume of a particular sector doesn’t necessarily indicate more or fewer searches; it simply signifies that its searches account for a larger or smaller portion of overall Google searches.
Conduct Comparative Studies with Overlaid Stock Charts
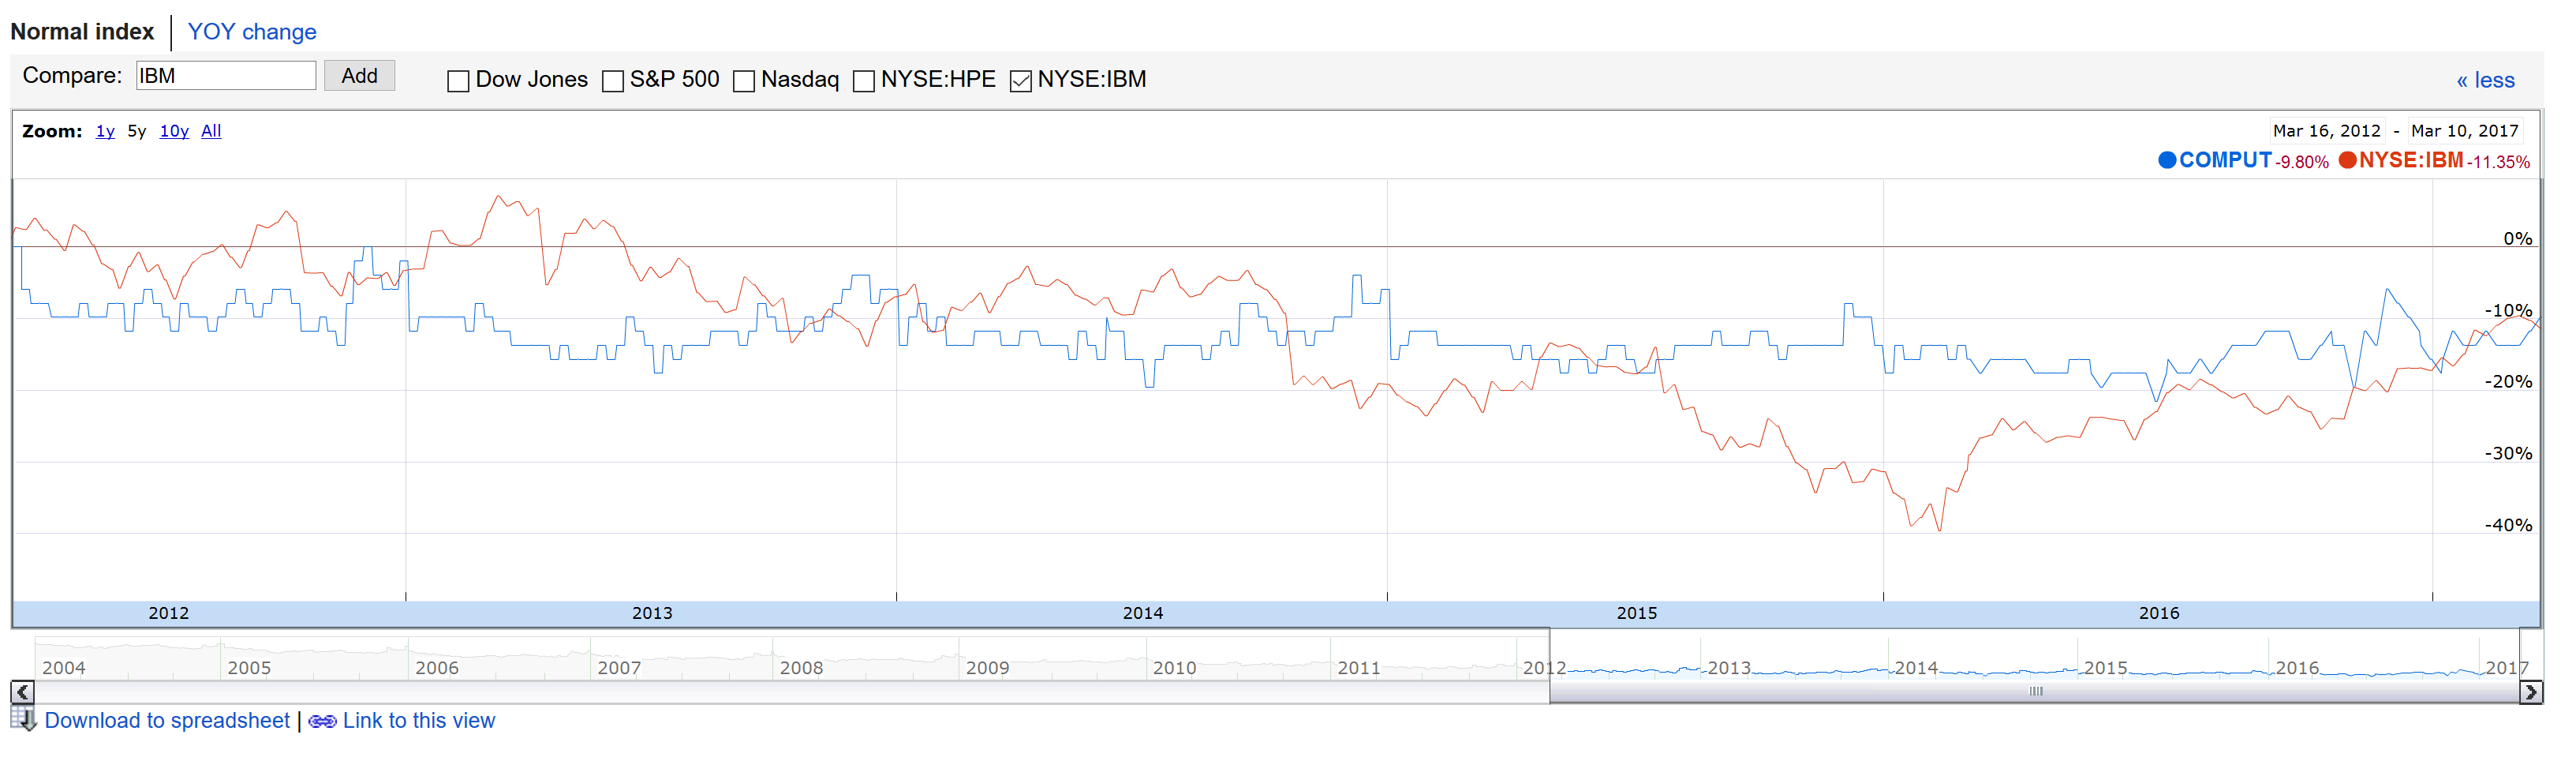
You can also overlay the price chart of any stock(s) on the trend graph for comparative analysis. Simply add the symbol name to the comparison box and click ‘Add.’ As demonstrated below, the price chart of ‘IBM’ is superimposed on the domestic trend chart for the ‘Computers and Electronics’ sector.
You can download the trend data in an Excel sheet for in-depth analysis. While Google Domestic Trends may not appear extremely valuable at the moment, it has the potential to become a powerful tool for market analysis in the future. Market sentiments are significantly influenced by mass opinions, and these trends naturally reflect those opinions.
Unlock Additional Features of Google Finance
Beyond the Stock Screener and Domestic Trends, Google Finance offers robust charting features with a wide range of indicators. These charts update in real-time for most global exchanges. Additionally, you can create and track your stocks and mutual funds in Google Portfolio, another free feature.
Access Real-Time Stock Prices in Google Sheets
You can also use the Google Finance function to access real-time stock prices in Excel sheets (Google Sheets). For examples, refer to the following sheets:
Camarilla Pivot Points Excel Sheet: Live Signals
Intraday Precision: Unveiling the Open High Low Strategy
Why invest in expensive charting applications when you can use Google Finance for free? We highly recommend that beginners explore Google Finance and incorporate it into their trading routines.