Opening Range Breakout (ORB) Trading Strategy
Opening Range Breakout (ORB) is probably the most popular intraday trading system. It takes into account the volatility of the first few minutes of trading hours, and any breakout above or below the price range of this period is considered a possible trade. The credit behind this system goes to Sir Tony Crabel who published a book in 1990 to explain this strategy in detail.
How to trade Opening Range Breakout?
First of all, you have to decide a specific period in the intraday chart which would be called as Opening range period. This period may vary depending on the security you are trading. The high made during this period is called the Opening Range High, and the low is called the Opening Range Low. The system gives a Buy signal when the price crosses above the Opening range while it gives a Sell signal when the price crosses below the Opening range. Aggressive traders may take the trade as soon as the breakout happens, while conservative traders may wait for a specific period or price move before entering. The time range between which the trade can be taken is called Trade Start time and Trade End time. There can be predefined targets and stop-loss depending on your risk management, but all positions should be necessarily squared off at the end of the day.
Below are the parameters for the AFL we are going to discuss below:
- Opening Range Period: 5 Minutes
- Trade Start Time: 55 minutes after Market Open
- Trade End Time: 70 minutes after Market Open
Please note that this AFL is available in its raw form in most of the online forums and communities. We have just optimized it for Nifty Futures and made it backtestable.
AFL Overview
| Parameter | Value |
| Preferred Timeframe | Intraday 5 minute |
| Indicators Used | None |
| Buy Condition |
|
| Short Condition |
|
| Sell Condition |
|
| Cover Condition |
|
| Stop Loss | 0.5% |
| Targets | 3% |
| Position Size | 150 (fixed) |
| Initial Equity | 200000 |
| Brokerage | 50 per order |
| Margin | 10% |
AFL Code
					//------------------------------------------------------
//  Formula Name:    Intraday Opening Range Breakout system
//  Website:         https://zerobrokerageclub.com/
//------------------------------------------------------


function ParamOptimize( pname, defaultval, minv, maxv, step )
{
return Optimize( pname,
Param( pname, defaultval, minv, maxv, step ),
minv, maxv, step );
}

_SECTION_BEGIN("Intraday Opening Range Breakout system");

SetOption( "InitialEquity", 200000);
SetOption("FuturesMode" ,True);
SetOption("MinShares",1);
SetOption("CommissionMode",2);
SetOption("CommissionAmount",50);
SetOption("AccountMargin",10);
SetOption("RefreshWhenCompleted",True);
SetPositionSize(150,spsShares);
SetOption( "AllowPositionShrinking", True );

//--Intraday time frame
TimeFrameSet(in5Minute);
TimeFrameInMinutes = 5;

//--Define all params
EntryBufferPct = ParamOptimize("Entry Buffer %", 0, 0, 2, 0.1);
SLPct = ParamOptimize("SL %", 0.5, 0.5, 2, 0.5);
TargetPct = ParamOptimize("Target %", 3, 0, 3, 0.5);
MaxTarget = 100;
TargetPct = IIf(TargetPct == 0, MaxTarget, TargetPct);
EntryTimeStart = ParamOptimize("Entry Time Start (Minutes)", 55, 5, 120, 5);
EntryBarStart = floor(EntryTimeStart/TimeFrameInMinutes) - 1;
EntryTimeEnd = ParamOptimize("Entry Time End (Minutes)", 70, 10, 300, 10);
EntryBarEnd = floor(EntryTimeEnd/TimeFrameInMinutes) - 1;
EntryBarEnd = IIf(EntryBarEnd < EntryBarStart, EntryBarStart, EntryBarEnd);

//--Plot Price Candle Chart
SetChartOptions(0,chartShowArrows|chartShowDates);
_N(Title = StrFormat("{{NAME}} - {{INTERVAL}} {{DATE}} Open %g, Hi %g, Lo %g, Close %g (%.1f%%) {{VALUES}}", O, H, L, C, SelectedValue( ROC( C, 1 ) ) ));
Plot( Close, "Price", colorWhite, styleCandle );

//--New Day & Time. End Day & Time . End Day & Time is null till end of day 1
NewDay = (Day()!= Ref(Day(), -1)) OR BarIndex() == 0;
printf("\n NewDay  : " + NewDay );
EndDay = (Day()!= Ref(Day(), 1));
printf("\n EndDay  : " + EndDay );
FirstBarTime = ValueWhen(NewDay,TimeNum(),1);
EndTime = ValueWhen(EndDay,TimeNum(),1);
SquareOffTime = EndTime;

//--Calculate ORB, and SL
HighestOfDay = HighestSince(NewDay,H,1);
LowestOfDay = LowestSince(NewDay,L,1);
ORBH = ValueWhen(NewDay,HighestOfDay ,1) * (1 + (EntryBufferPct/100));
ORBL = ValueWhen(NewDay,LowestOfDay ,1) * (1 - (EntryBufferPct/100));


//--Find Buy, Sell, Short & Cover Signals
BarsSinceNewDay = BarsSince(NewDay);
BuySignal = (H >= ORBH) AND (BarsSinceNewDay  > EntryBarStart);
printf("\nBuySignal : " + BuySignal );
ShortSignal = (L <= ORBL) AND (BarsSinceNewDay  > EntryBarStart) ;
printf("\nShortSignal  : " + ShortSignal );
BarsSinceLastBuySignal = (BarsSince(Ref(BuySignal,-1)) + 1);
BarsSinceLastShortSignal = (BarsSince(Ref(ShortSignal,-1)) + 1);
BarsSinceLastEntrySignal = Min(BarsSinceLastBuySignal, BarsSinceLastShortSignal);
BothEntrySignalsNull = IsNull(BarsSinceLastBuySignal) AND IsNull(BarsSinceLastShortSignal); //true for start of Day 1
printf("\n\nBarsSinceNewDay : " + BarsSinceNewDay );
printf("\nBarsSinceLastBuySignal : " + BarsSinceLastBuySignal );
printf("\nBarsSinceLastShortSignal : " + BarsSinceLastShortSignal );
printf("\n BarsSinceLastEntrySignal : " + BarsSinceLastEntrySignal);
Buy = (H >= ORBH) AND (BarsSinceNewDay  > EntryBarStart) AND (BarsSinceNewDay <= EntryBarEnd) AND ((BarsSinceNewDay < BarsSinceLastEntrySignal) OR BothEntrySignalsNull );
Short = (L <= ORBL) AND (BarsSinceNewDay  > EntryBarStart) AND (BarsSinceNewDay <= EntryBarEnd) AND ((BarsSinceNewDay < BarsSinceLastEntrySignal) OR BothEntrySignalsNull );
BuyPrice = IIf(Buy, Max(ORBH,O), Null);
ShortPrice = IIf(Short, Min(ORBL,Open), Null);

ORBHSL = ValueWhen(BuyPrice,BuyPrice) * (1-(SLPct/100));
ORBLSL = ValueWhen(ShortPrice,ShortPrice) * (1+(SLPct/100));
ORBHTarget = ValueWhen(BuyPrice,BuyPrice) * (1+(TargetPct/100));
ORBLTarget = ValueWhen(ShortPrice,ShortPrice) * (1-(TargetPct/100));

Sell = (L <= ORBHSL) OR (H >= ORBHTarget) OR (TimeNum() > SquareOffTime-1) AND (BarsSinceNewDay > BarsSinceLastBuySignal);
Cover = (H >= ORBLSL) OR (L <= ORBLTarget) OR (TimeNum() > SquareOffTime-1) AND (BarsSinceNewDay > BarsSinceLastShortSignal);

SellPrice = IIf(Sell, IIf(H >= ORBHTarget, ORBHTarget, Max(ORBHSL, L)), Null);
CoverPrice = IIf(Cover, IIf(L <= ORBLTarget, ORBLTarget, Min(ORBLSL, H)), Null);

printf("\nBuy : " + Buy );
printf("\nSell : " + Sell );
printf("\nShort : " + Short );
printf("\nCover : " + Cover );

printf("\nORBH : " + ORBH );
printf("\nORBL : " + ORBL );
printf("\nBuyPrice : " + BuyPrice );
printf("\nShortPrice : " + ShortPrice );

printf("\nORBHSL : " + ORBHSL );
printf("\nORBLSL : " + ORBLSL );
printf("\nORBHTarget : " + ORBHTarget );
printf("\nORBLTarget : " + ORBLTarget );

//--Handle if ORB broken both sides on same bar
//--And remove duplicate Sell & Cover signals, since ExRem did not work as needed when Buy & Sell on same bar
orbBothSides = IIf(Buy AND Short, 1, 0);
Buy = IIf(orbBothSides AND C <= O, 0, Buy);
Short = IIf(orbBothSides AND C > O, 0, Short);
Sell = IIf(orbBothSides AND C > O AND (L <= ORBHSL), 1, Sell);
Sell = IIf((BarsSince(Buy) < (BarsSince(Ref(Sell,-1))+1)) OR (BarsSince(Buy) AND IsNull(BarsSince(Ref(Sell,-1)))),Sell,0);
Cover = IIf(orbBothSides AND C <= O AND (H >= ORBLSL), 1, Cover);
Cover = IIf((BarsSince(Short) < (BarsSince(Ref(Cover,-1))+1)) OR (BarsSince(Short) AND IsNull(BarsSince(Ref(Cover,-1)))),Cover,0);


//Plot(IIf(BarsSinceNewDay > BarsSinceLastBuySignal,ORBHSL,NULL),"BuyStopLoss",colorRed,styleDashed);
//Plot(IIf(BarsSinceNewDay > BarsSinceLastShortSignal,ORBLSL,NULL),"SellStopLoss",colorRed,styleDashed);
Plot(ORBH,"",colorBlue,styleDots);
Plot(ORBL,"",colorBlue,styleDots);


/* Plot Buy and Sell Signal Arrows */
PlotShapes(IIf(Buy, shapeSquare, shapeNone),colorGreen, 0, L, Offset=-40);
PlotShapes(IIf(Buy, shapeSquare, shapeNone),colorLime, 0,L, Offset=-50);
PlotShapes(IIf(Buy, shapeUpArrow, shapeNone),colorWhite, 0,L, Offset=-45);
PlotShapes(IIf(Cover, shapeSquare, shapeNone),colorGreen, 0, L, Offset=-40);
PlotShapes(IIf(Cover, shapeSquare, shapeNone),colorLime, 0,L, Offset=-50);
PlotShapes(IIf(Cover, shapeUpArrow, shapeNone),colorWhite, 0,L, Offset=-45);
PlotShapes(IIf(Sell, shapeSquare, shapeNone),colorRed, 0, H, Offset=40);
PlotShapes(IIf(Sell, shapeSquare, shapeNone),colorOrange, 0,H, Offset=50);
PlotShapes(IIf(Sell, shapeDownArrow, shapeNone),colorWhite, 0,H, Offset=-45);
PlotShapes(IIf(Short, shapeSquare, shapeNone),colorRed, 0, H, Offset=40);
PlotShapes(IIf(Short, shapeSquare, shapeNone),colorOrange, 0,H, Offset=50);
PlotShapes(IIf(Short, shapeDownArrow, shapeNone),colorWhite, 0,H, Offset=-45);


//--Restore time frame
TimeFrameRestore();
_SECTION_END();
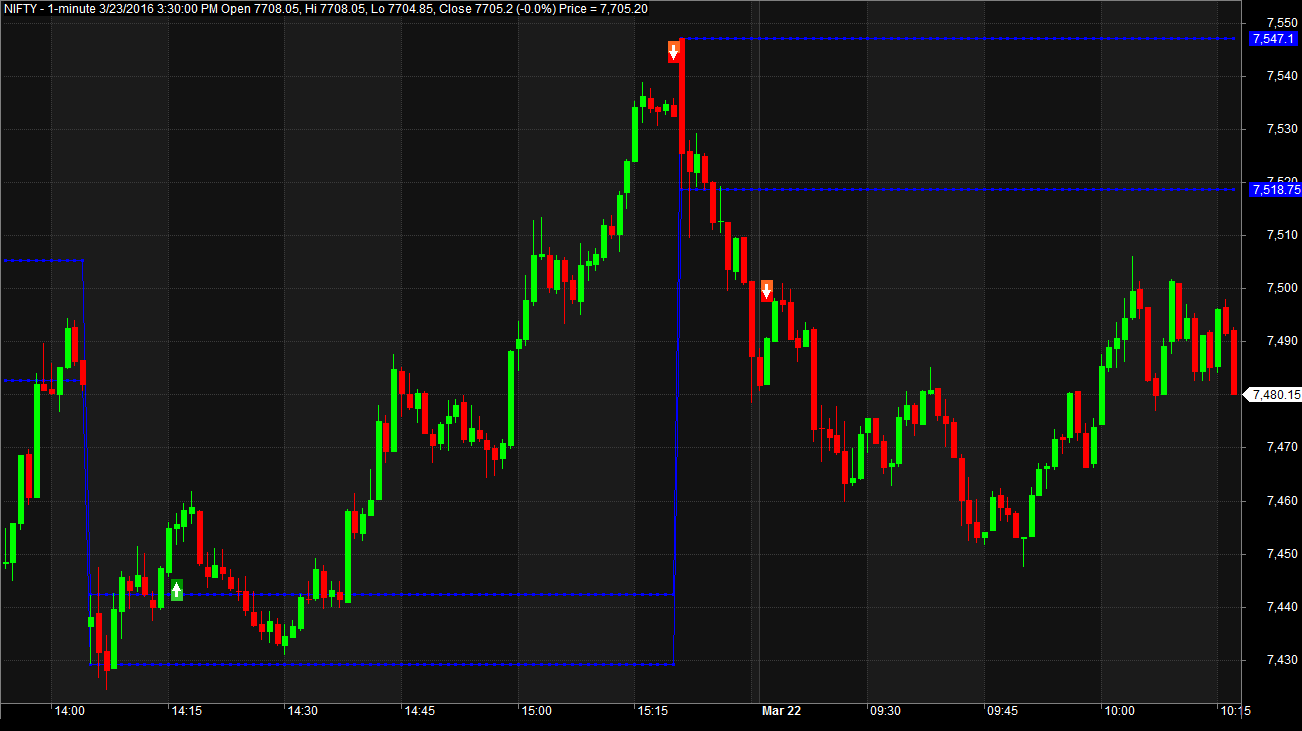
AFL Screenshot
The blue dotted line shows the Opening Range.
Backtest Report
| Parameter | Value |
| Fixed Position Size | |
| Initial Capital | 200000 |
| Final Capital | 662679.55 |
| Backtest Period | 01-Jan-2015 to 22-03-2016 |
| Timeframe | 5 Minutes |
| Net Profit % | 231.34% |
| Annual Return % | 165.97% |
| Number of Trades | 259 |
| Winning Trade % | 54.44% |
| Average holding Period | 55.46 periods |
| Max consecutive losses | 13 |
| Max system % drawdown | -20.02% |
| Max Trade % drawdown | -12.83% |
Download the detailed backtest report here.
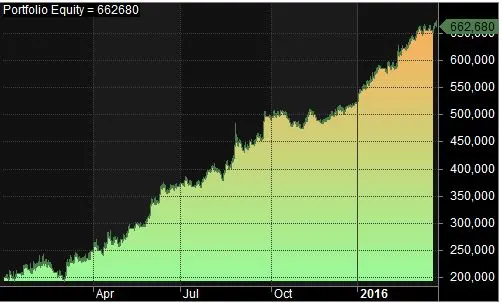
Equity Curve
This strategy has a very smooth and linear equity curve with minimum drawdowns. Check it out.
Additional Amibroker settings for backtesting
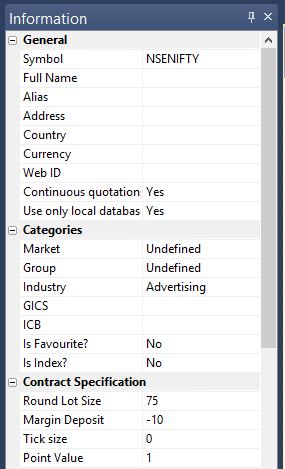
Goto Symbol–>Information, and specify the lot size and margin requirement. The below screenshot shows lot size of 75 and margin requirement of 10% for NSE Nifty: