
Introduction to Trend Intensity Index (TII)

The Trend Intensity Index (TII) is an effective oscillator for measuring the current trend’s strength in financial instruments. It stands out for its ability to work alone or alongside other trend-following indicators, providing clear insights into price movements during trending markets.

About TII’s Creator and Function

M.H Pee developed TII, a tool that varies between 0 and 100%. If the value exceeds 80%, it signals a strong bullish trend. Conversely, a value under 20% suggests a strong bearish trend. TII also includes a signal line, the 9-period exponential moving average of the TII line itself.

Best Timeframes for TII

TII is flexible and works well in any timeframe you choose to analyze.

Additional Learning Resources: Know Sure Thing (KST) AFL Code

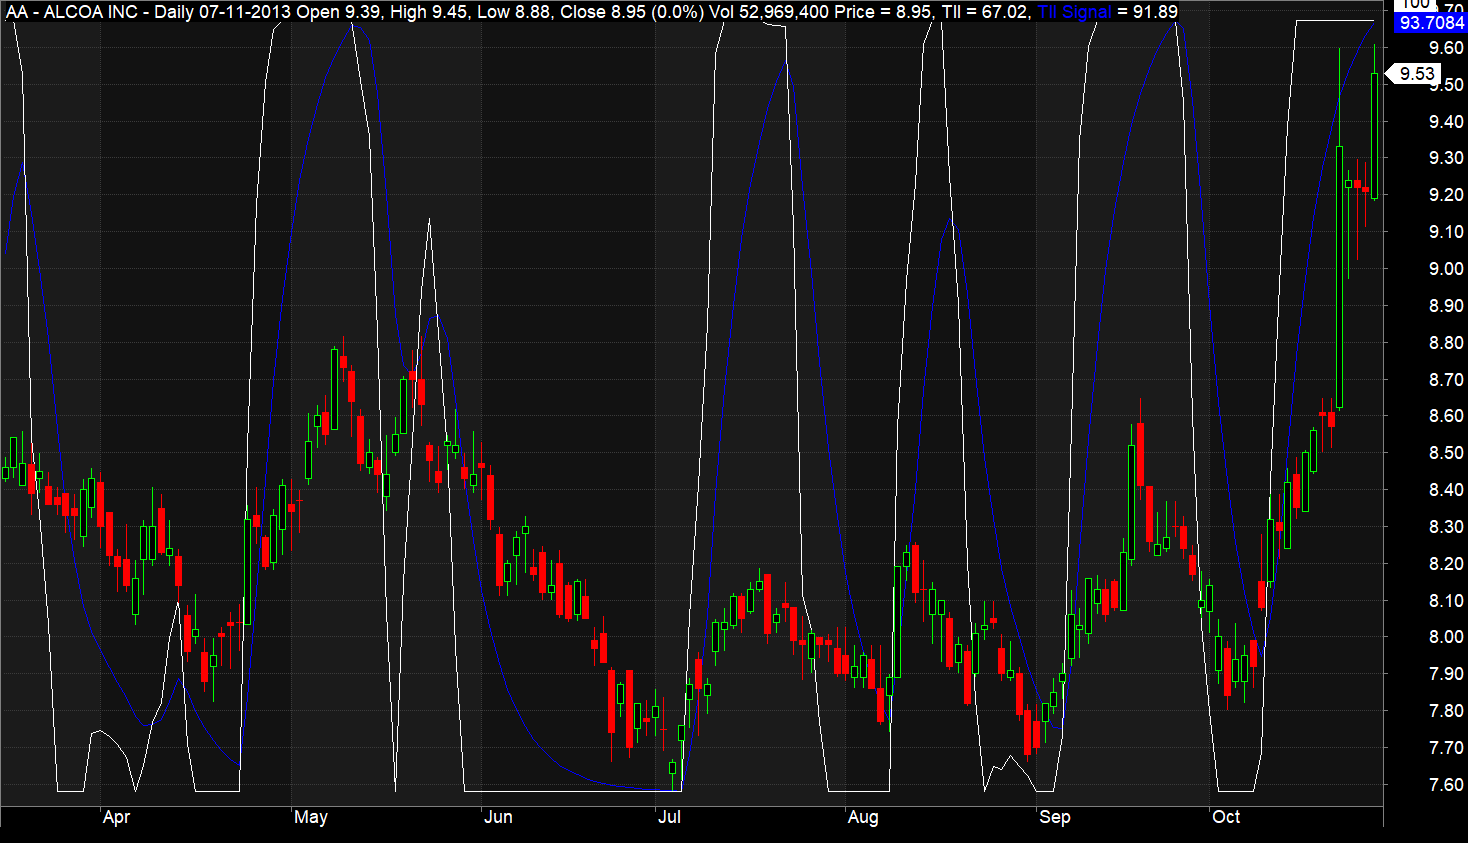
Visual Demonstration of TII

The image below shows the Trend Intensity Index (TII) on an Amibroker chart, depicted as a white line over the candlestick chart. Alongside TII, you’ll notice the signal line, presented as a blue line.

Trend-intensity-index-AFL-Screenshot

TII’s AFL Code

				
					//------------------------------------------------------
//
//  Formula Name:    Trend Intensity Index (TII)
//  Website:         https://zerobrokerageclub.com/
//------------------------------------------------------

_SECTION_BEGIN("Trend Intensity Index");

SetChartOptions(0,chartShowArrows|chartShowDates);

_N(Title = StrFormat("{{NAME}} – {{INTERVAL}} {{DATE}} Open %g, Hi %g, Lo %g, Close %g (%.1f%%) {{VALUES}}", O, H, L, C, SelectedValue( ROC( C, 1 ) ) ));


Plot( Close, "Price", colorWhite, styleCandle );

n = Param("Periods",10,5,100,5);

//Calculate Simple Moving Average (SMA) of the closing prices
SMA=MA(Close,n);

//Calculate Positive and Negative deviation of the closing prices from SMA calculated in step 1
Dev = Close - SMA;

posDev = IIf( Dev>0, Dev, 0 ); 
negDev = IIf( Dev<0, abs(Dev), 0 ); 

//Calculate sum of Positive and Negative deviations for the period twice smaller than period used for SMA calculation. 
if ( n%2 == 0)
    m = n/2;
else 
	m = (n+1)/2;

SDpos = sum(posDev, m);
SDneg = sum(negDev, m);

//Calculate Trend Intensity index
TII = 100 * (SDpos) / (SDpos + SDneg);

//Calculate second line (Signal line) as EMA applied to TII
TIISignal = EMA(TII, 9);


Plot( TII , "TII", colorWhite, styleLine | styleOwnScale ); 
Plot ( TIISignal ,"TII Signal", colorBlue, styleLine | styleOwnScale ); 

_SECTION_END();


Detailed Explanation of the TII AFL Code

Calculating TII involves several straightforward steps:

Step 1: Start by calculating the simple moving average (SMA) of the closing price over ‘n’ periods.

Step 2: Next, find the positive and negative deviations of each candle’s closing price from the SMA.

Dev = Close – SMA

If Dev is greater than 0, then posDev equals Dev; otherwise, negDev equals the absolute value of Dev.

Step 3: Sum up the Positive and Negative deviations over a period half that of the SMA period.

SDpos = sum(posDev, m); SDneg = sum(negDev, m);

‘m’ equals n/2 for an even ‘n’, and (n+1)/2 for an odd ‘n’.

Step 4: Use the following formula to calculate the Trend Intensity Index:

TII = 100 * (SDpos) / (SDpos + SDneg);

Step 5: Finally, calculate the signal line as the 9-period exponential moving average of TII.

TIISignal = EMA(TII, 9);

We then plot TII and TIISignal on the candlestick chart using Amibroker’s “plot” function.

Trading Strategies with TII

When using TII for trading, here are some straightforward rules to follow:

  • When TII is above 80, it suggests a strong uptrend.
  • A TII below 20 indicates a significant downtrend.
  • Consider going long if TII rises above 20.
  • Think about going short if TII falls below 80.
  • Go long when TII crosses above its signal line (TIISignal).
  • Go short when TII crosses below its signal line (TIISignal).