
Know Sure Thing (KST), a dynamic momentum indicator, was created by the esteemed technical analyst Martin Pring. It works by calculating the weighted sum of four distinct smoothed rates of change (ROC) over varying periods. The longest period receives the highest weight, while the shortest period gets the least.

The rate of change (ROC) is essentially the percentage difference between the current price and the price from a specific number of periods earlier.

Martin Pring first introduced KST in 1992 through an article in Stocks and Commodities Magazine. Since its inception, it has gained widespread popularity among traders worldwide. The KST indicator includes a signal line, which is the 9-period simple moving average of the KST line.

Optimal Timeframe Usage

KST is best utilized in longer timeframes, such as Daily or Weekly charts.

Related Reading: Triangular Moving Average AFL Code

Visual Representation

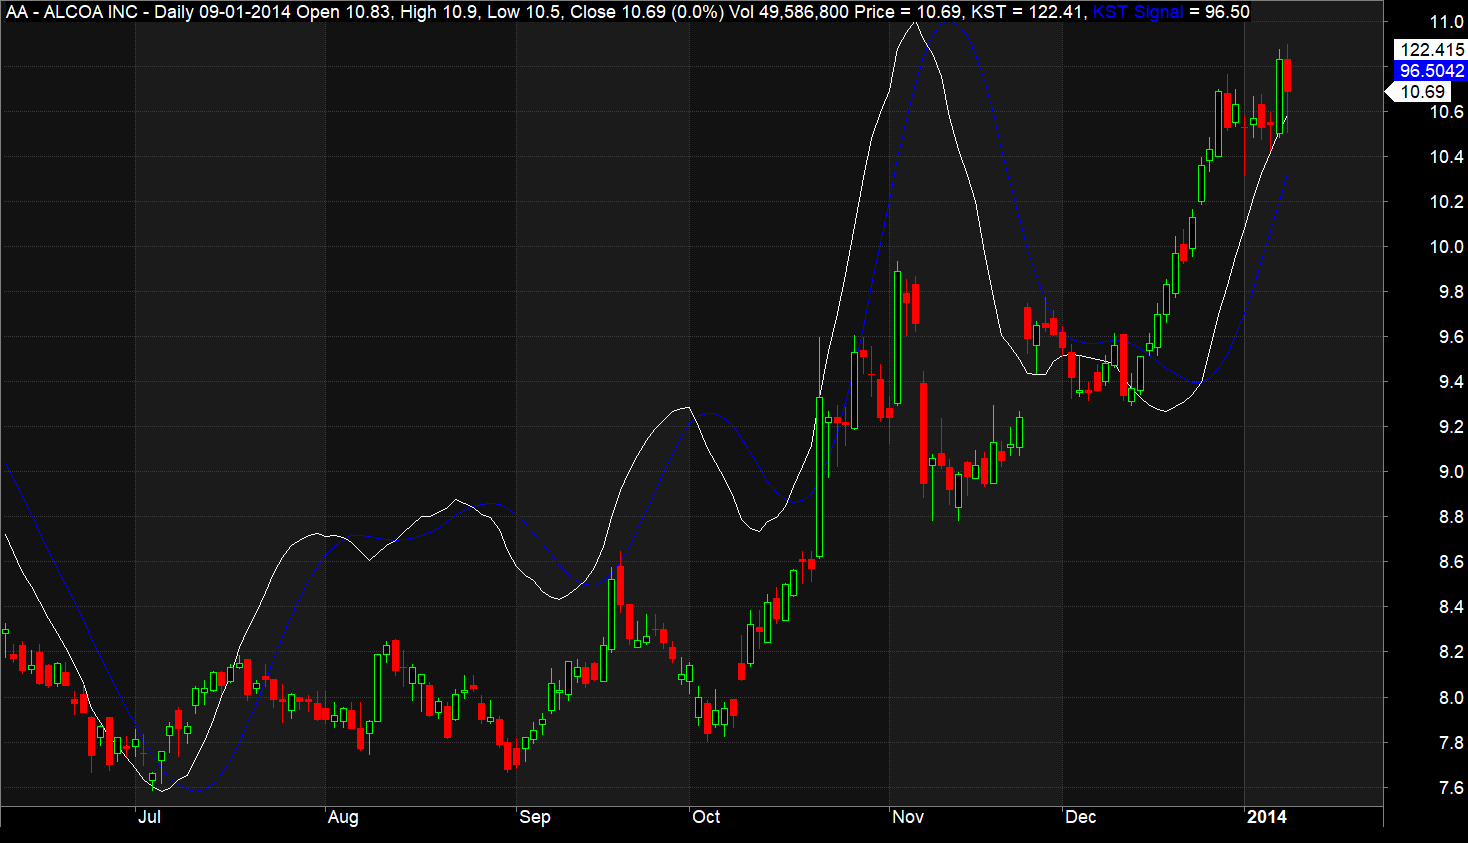
The screenshot below displays the Know Sure Thing (KST) indicator on an Amibroker chart, represented as a white line over the candlestick chart.

Additionally, the signal line of KST is illustrated as a blue line.

Know-Sure-Thing-AFL-Screenshot

Download the Know Sure Thing (KST) AFL

				
					//------------------------------------------------------
//
//  Formula Name:    Know Sure Thing (KST)
//  Website:         https://zerobrokerageclub.com/
//------------------------------------------------------

_SECTION_BEGIN("Know Sure Thing (KST)");

SetChartOptions(0,chartShowArrows|chartShowDates);

_N(Title = StrFormat("{{NAME}} – {{INTERVAL}} {{DATE}} Open %g, Hi %g, Lo %g, Close %g (%.1f%%) {{VALUES}}", O, H, L, C, SelectedValue( ROC( C, 1 ) ) ));


Plot( Close, "Price", colorWhite, styleCandle );

RCMA1 = MA(ROC(C,10),10);
RCMA2 = MA(ROC(C,15),10);
RCMA3 = MA(ROC(C,20),10);
RCMA4 = MA(ROC(C,30),15);

KST = (RCMA1 * 1) + (RCMA2 * 2) + (RCMA3 * 3) + (RCMA4 * 4);  

KSTSignal = MA(KST,9);

Plot( KST , "KST", colorWhite, styleLine | styleOwnScale ); 
Plot ( KSTSignal ,"KST Signal", colorBlue, styleLine | styleOwnScale ); 

_SECTION_END();


Understanding the AFL Code

Once the chart title and candlestick chart are set up, we compute KST and KSTSignal using these formulas:

KST = Sum of (RCMA1 * 1, RCMA2 * 2, RCMA3 * 3, RCMA4 * 4)

KSTSignal = 9-period Moving Average of KST

Definitions:

RCMA1 = 10-period SMA of 10-period Rate-of-Change

RCMA2 = 10-period SMA of 15-period Rate-of-Change

RCMA3 = 10-period SMA of 20-period Rate-of-Change

RCMA4 = 15-period SMA of 30-period Rate-of-Change

MA = Simple Moving Average

Subsequently, KST and KSTSignal are represented on the candlestick chart using Amibroker’s standard “plot” function.

Guidelines for Long and Short Positions

When using KST for trading, consider these rules for long and short positions:

  • A rising KST indicates an uptrend.
  • A falling KST suggests a downtrend.
  • Enter a long position when KST crosses above the KSTSignal.
  • Opt for a short position when KST crosses below the KSTSignal.
  • KST is also valuable for detecting technical divergences between price trends and the indicator. For example, if the price reaches a higher high but KST shows a lower high, it may indicate weakening bullishness. Conversely, if the price falls to a lower low and KST points to a higher low, it could signal the end of a bearish phase.

One Comment

Leave a Reply