

Exploring the Power of ADX: Your Trend Strength Companion
We’re committed to the world of ‘Trend Following’ and firmly believe in its unwavering significance. This article delves into the versatile Trend Strength Indicator used by technical analysts, known as Average Directional Index (ADX). ADX helps assess trend strength and, when combined with +DI and -DI, provides insights into trend direction. We’ll explore how to use these three indicators effectively to stay in tune with the prevailing trend. You can download real-time stock quotes with ADX values from the link provided at the end of this post.
Discover our popular Excel-based trading systems here.
Understanding ADX: Your Trend Strength Gauge
The Average Directional Index, ADX, is a non-directional trend strength indicator. Its values range from 0 to 100, with higher values indicating stronger trends. The default look-back period for ADX is 14 periods, but this period can be adjusted based on a stock’s volatility. Developed by J. Welles Wilder in 1978, ADX is often used in conjunction with +DI and -DI to determine trend direction.
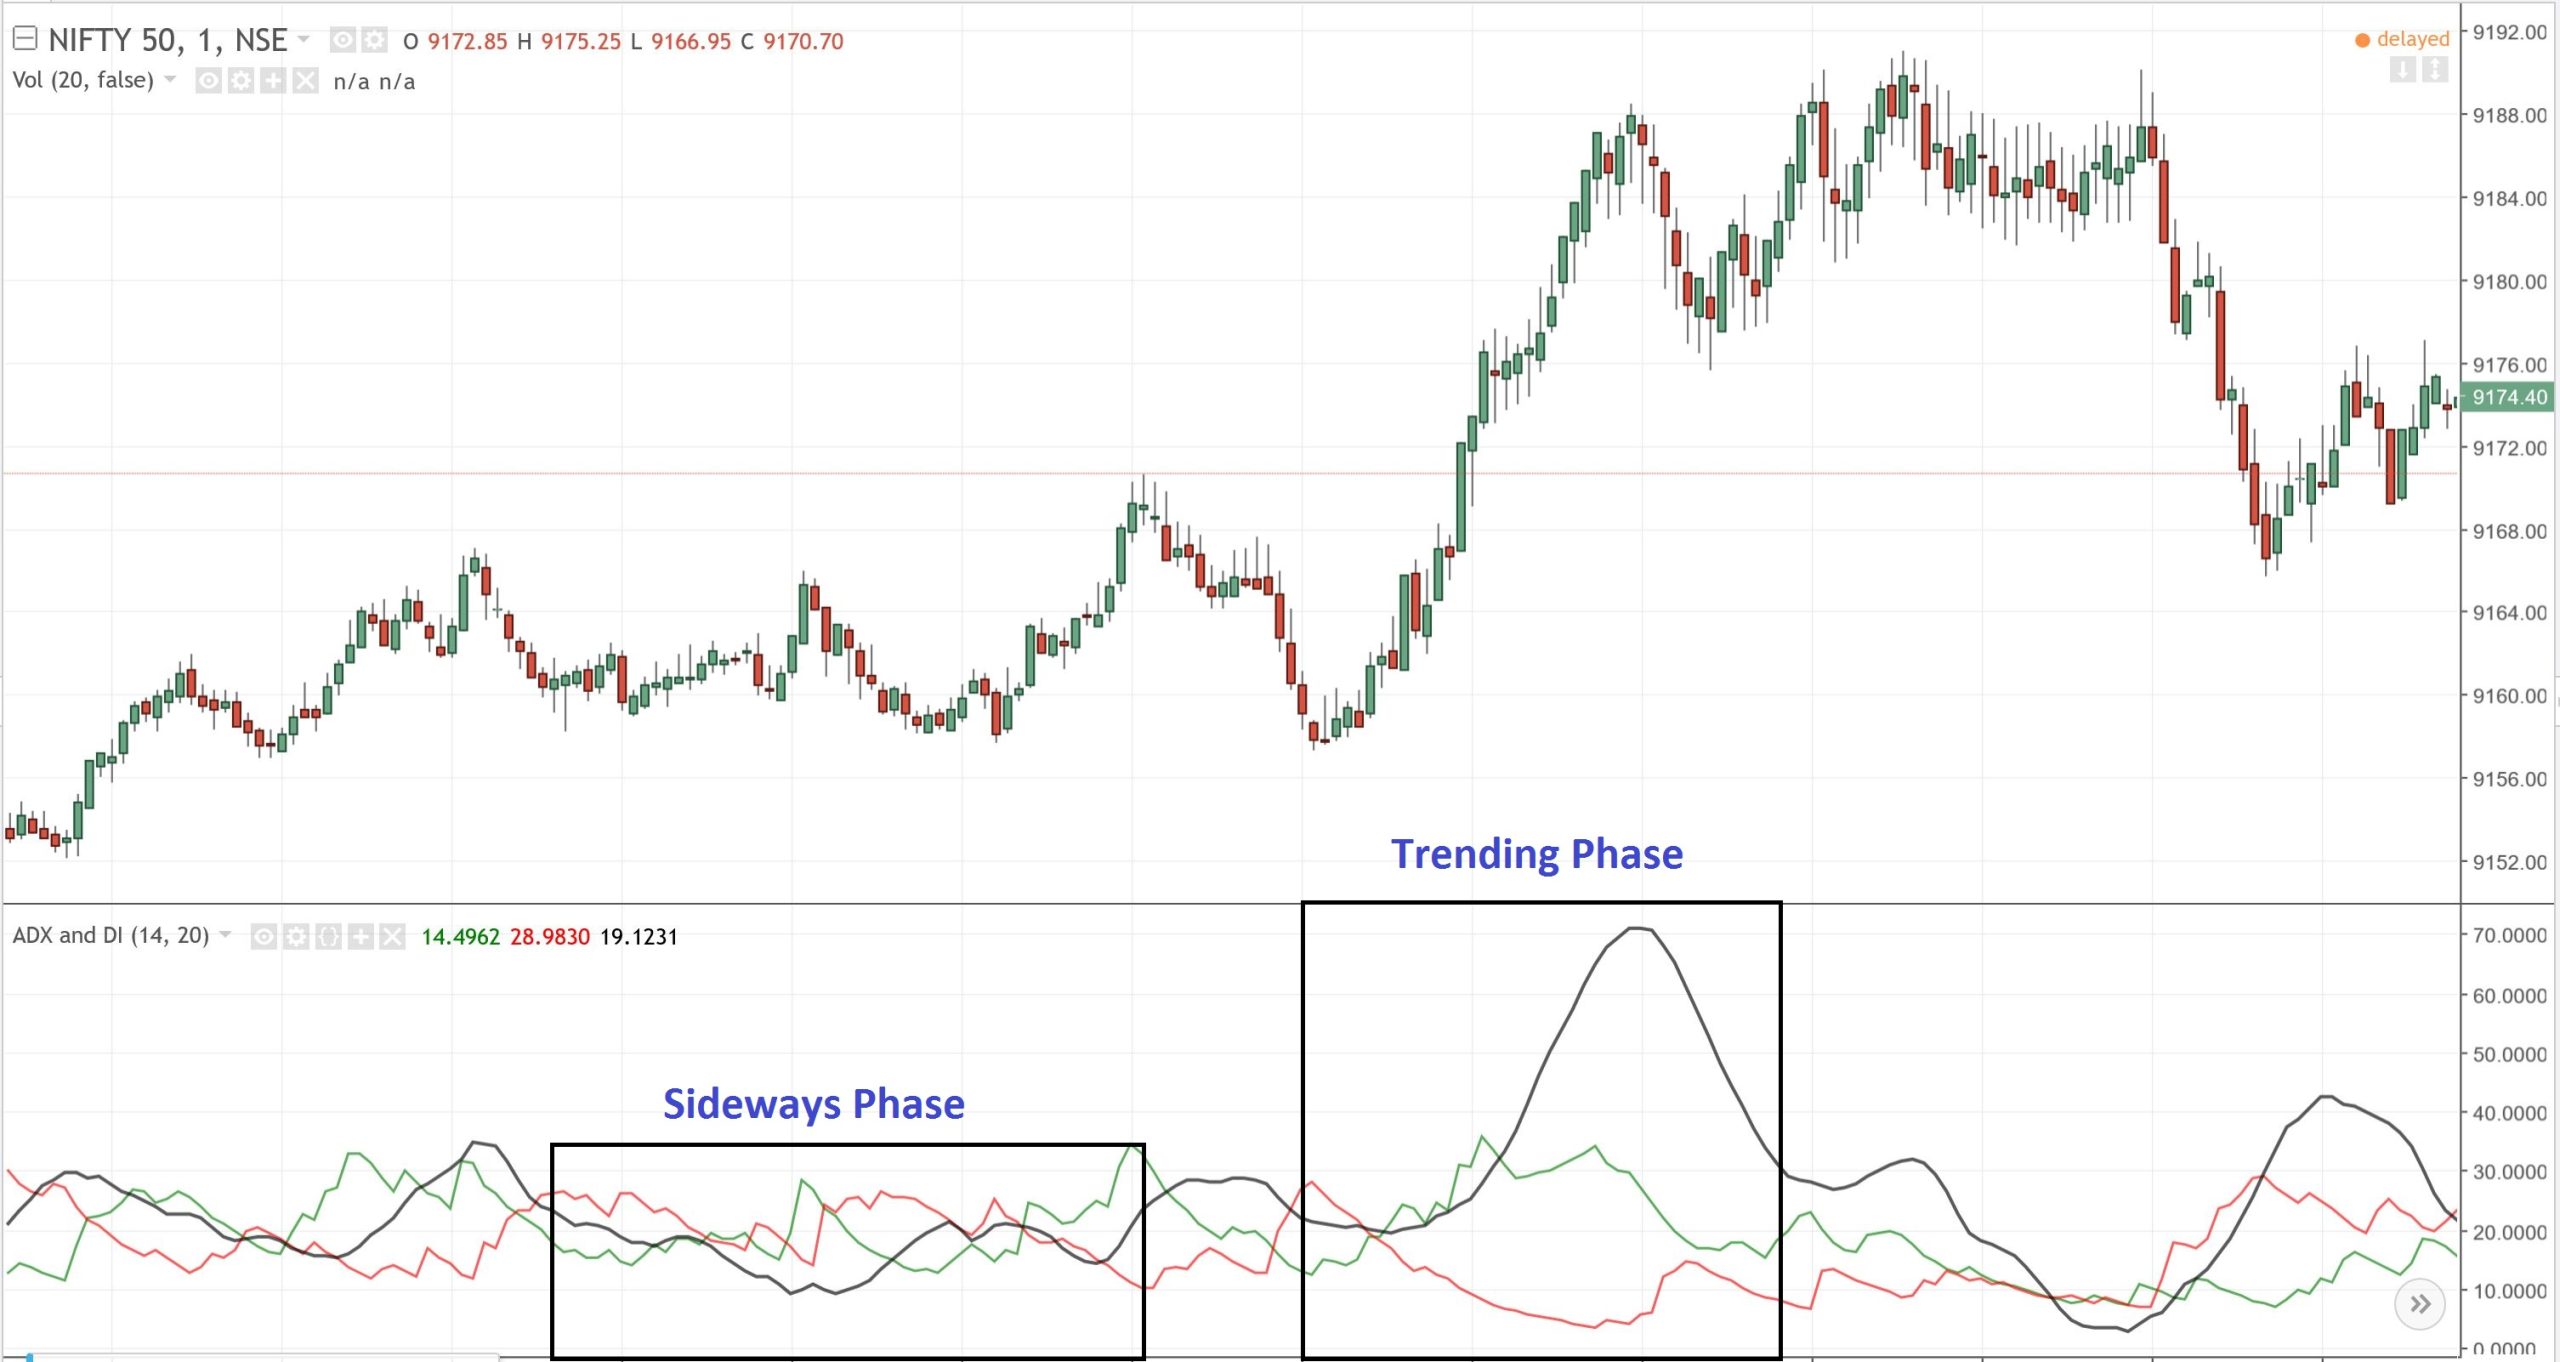
On a stock chart, ADX appears as a single line, as shown below:
Calculating ADX: Demystifying the Process
To calculate ADX accurately, you’ll need a minimum of 150 periods’ worth of high, low, and close values. Higher periods yield more precise ADX values due to Wilder’s smoothing techniques. Here’s a breakdown of the calculation:
- Calculate the True Range (TR), which is the maximum of:
- Current High minus Current Low
- Current High minus Previous Close
- Current Low minus Previous Close
- Compute +DM1 and -DM1, measuring directional movement. +DM1 is positive when the current high minus the previous high is greater than the previous low minus the current low, and -DM1 is negative when the reverse is true.
- Derive the 14-period moving average of True Range (TR14), +DM1, and -DM1.
- Calculate +DI14 and -DI14, expressed as percentages.
- Compute the Directional Movement Index (DX), expressed as a percentage.
- Calculate the Average Directional Index (ADX), which is a 14-period moving average of DX.
Don’t worry about these complex calculations; our downloadable Excel sheet handles it all.
Unlocking the Secrets: Interpreting ADX
ADX is a powerful trend strength indicator, with values ranging from 0 to 100. Interpretation varies by range:
| ADX Value | Trend Strength |
| 0-25 | Weak or No Trend |
| 25-50 | Moderate Trend |
| 50-75 | Strong Trend |
| 75-100 | Very Strong Trend |
Combining ADX with other trend-following systems helps avoid whipsaws in sideways markets.
In practice, ADX is typically used alongside +DI and -DI indicators to determine trend direction. When +DI exceeds -DI, it signals a bullish trend, and the reverse suggests a bearish trend. Crossovers of these lines can fine-tune your trade timing.
ADX Excel Sheet: A Tool for Your Convenience
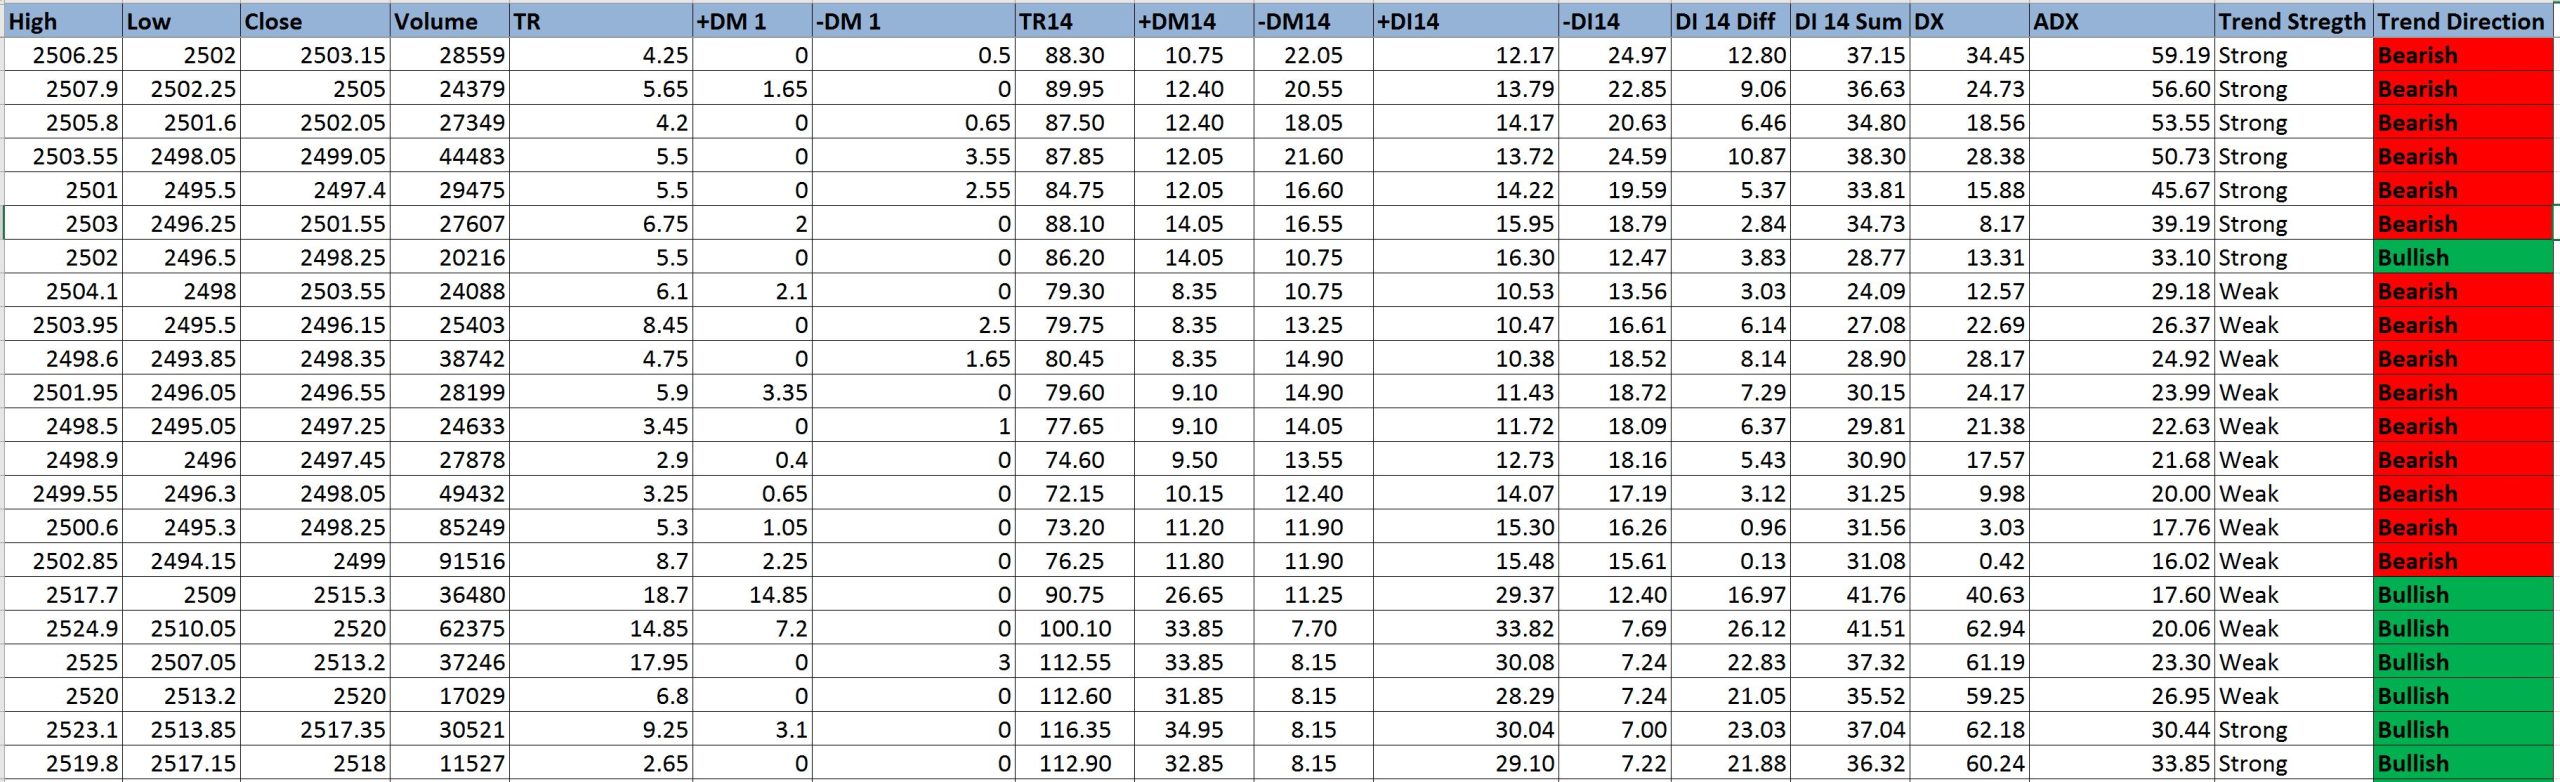
Our semi-automated Excel sheet simplifies the process. Just enter the stock name, exchange, timeframe, and the Excel sheet will handle the rest. It not only calculates ADX and DI values but also provides trend strength and direction. ADX below 30 indicates a weak trend, while values above 30 indicate a strong trend.
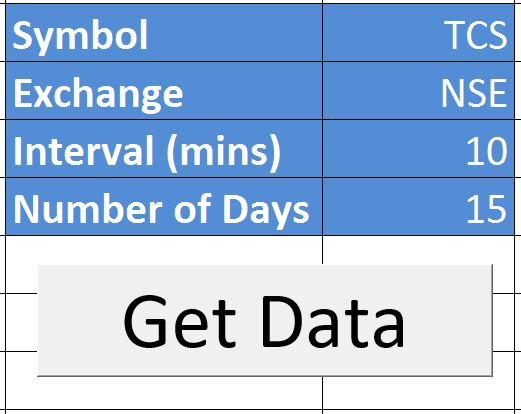
See the screenshots below:
How to Use the Excel Sheet
Step 1: Download the Excel file from the link provided at the end of this post.
Step 2: Open the Excel file, ensure an internet connection, and enable Macros and Data connections if prompted.
Step 3: Input the Symbol Name, Exchange Name, Interval, and Number of Days.
Step 4: Click “Get Data,” and the Excel sheet will download the data and calculate ADX values. Data can be downloaded for up to 15 days with a minimum interval of 1 minute.
Download the ADX Trend Strength Indicator Excel Sheet from here.


2 Comments