
The Supertrend indicator is a favorite among traders, especially for Intraday timing. If you’re into technical analysis, you’ve probably encountered this tool. Known for its sharp accuracy across different timeframes, it’s a handy tool for trading stocks, commodities, or Forex. However, not all trading platforms offer it. That’s why we’ve created a handy Supertrend Indicator Excel Sheet to calculate real-time indicator values and buy/sell signals. This tailored sheet fits well with all major exchanges. Explore the calculations of Supertrend and grab the Excel sheet download at the end of this post.
Cracking the Supertrend Indicator Calculation
Like moving averages, Supertrend helps track market trends. It uses the Average True Range (ATR) and a multiplier value for its calculations, with ATR gauging market volatility.
Here’s the drill: a buy signal pops up when the Supertrend indicator is above the price, and a sell signal shows up when it’s below the closing price.
The Math Behind Supertrend
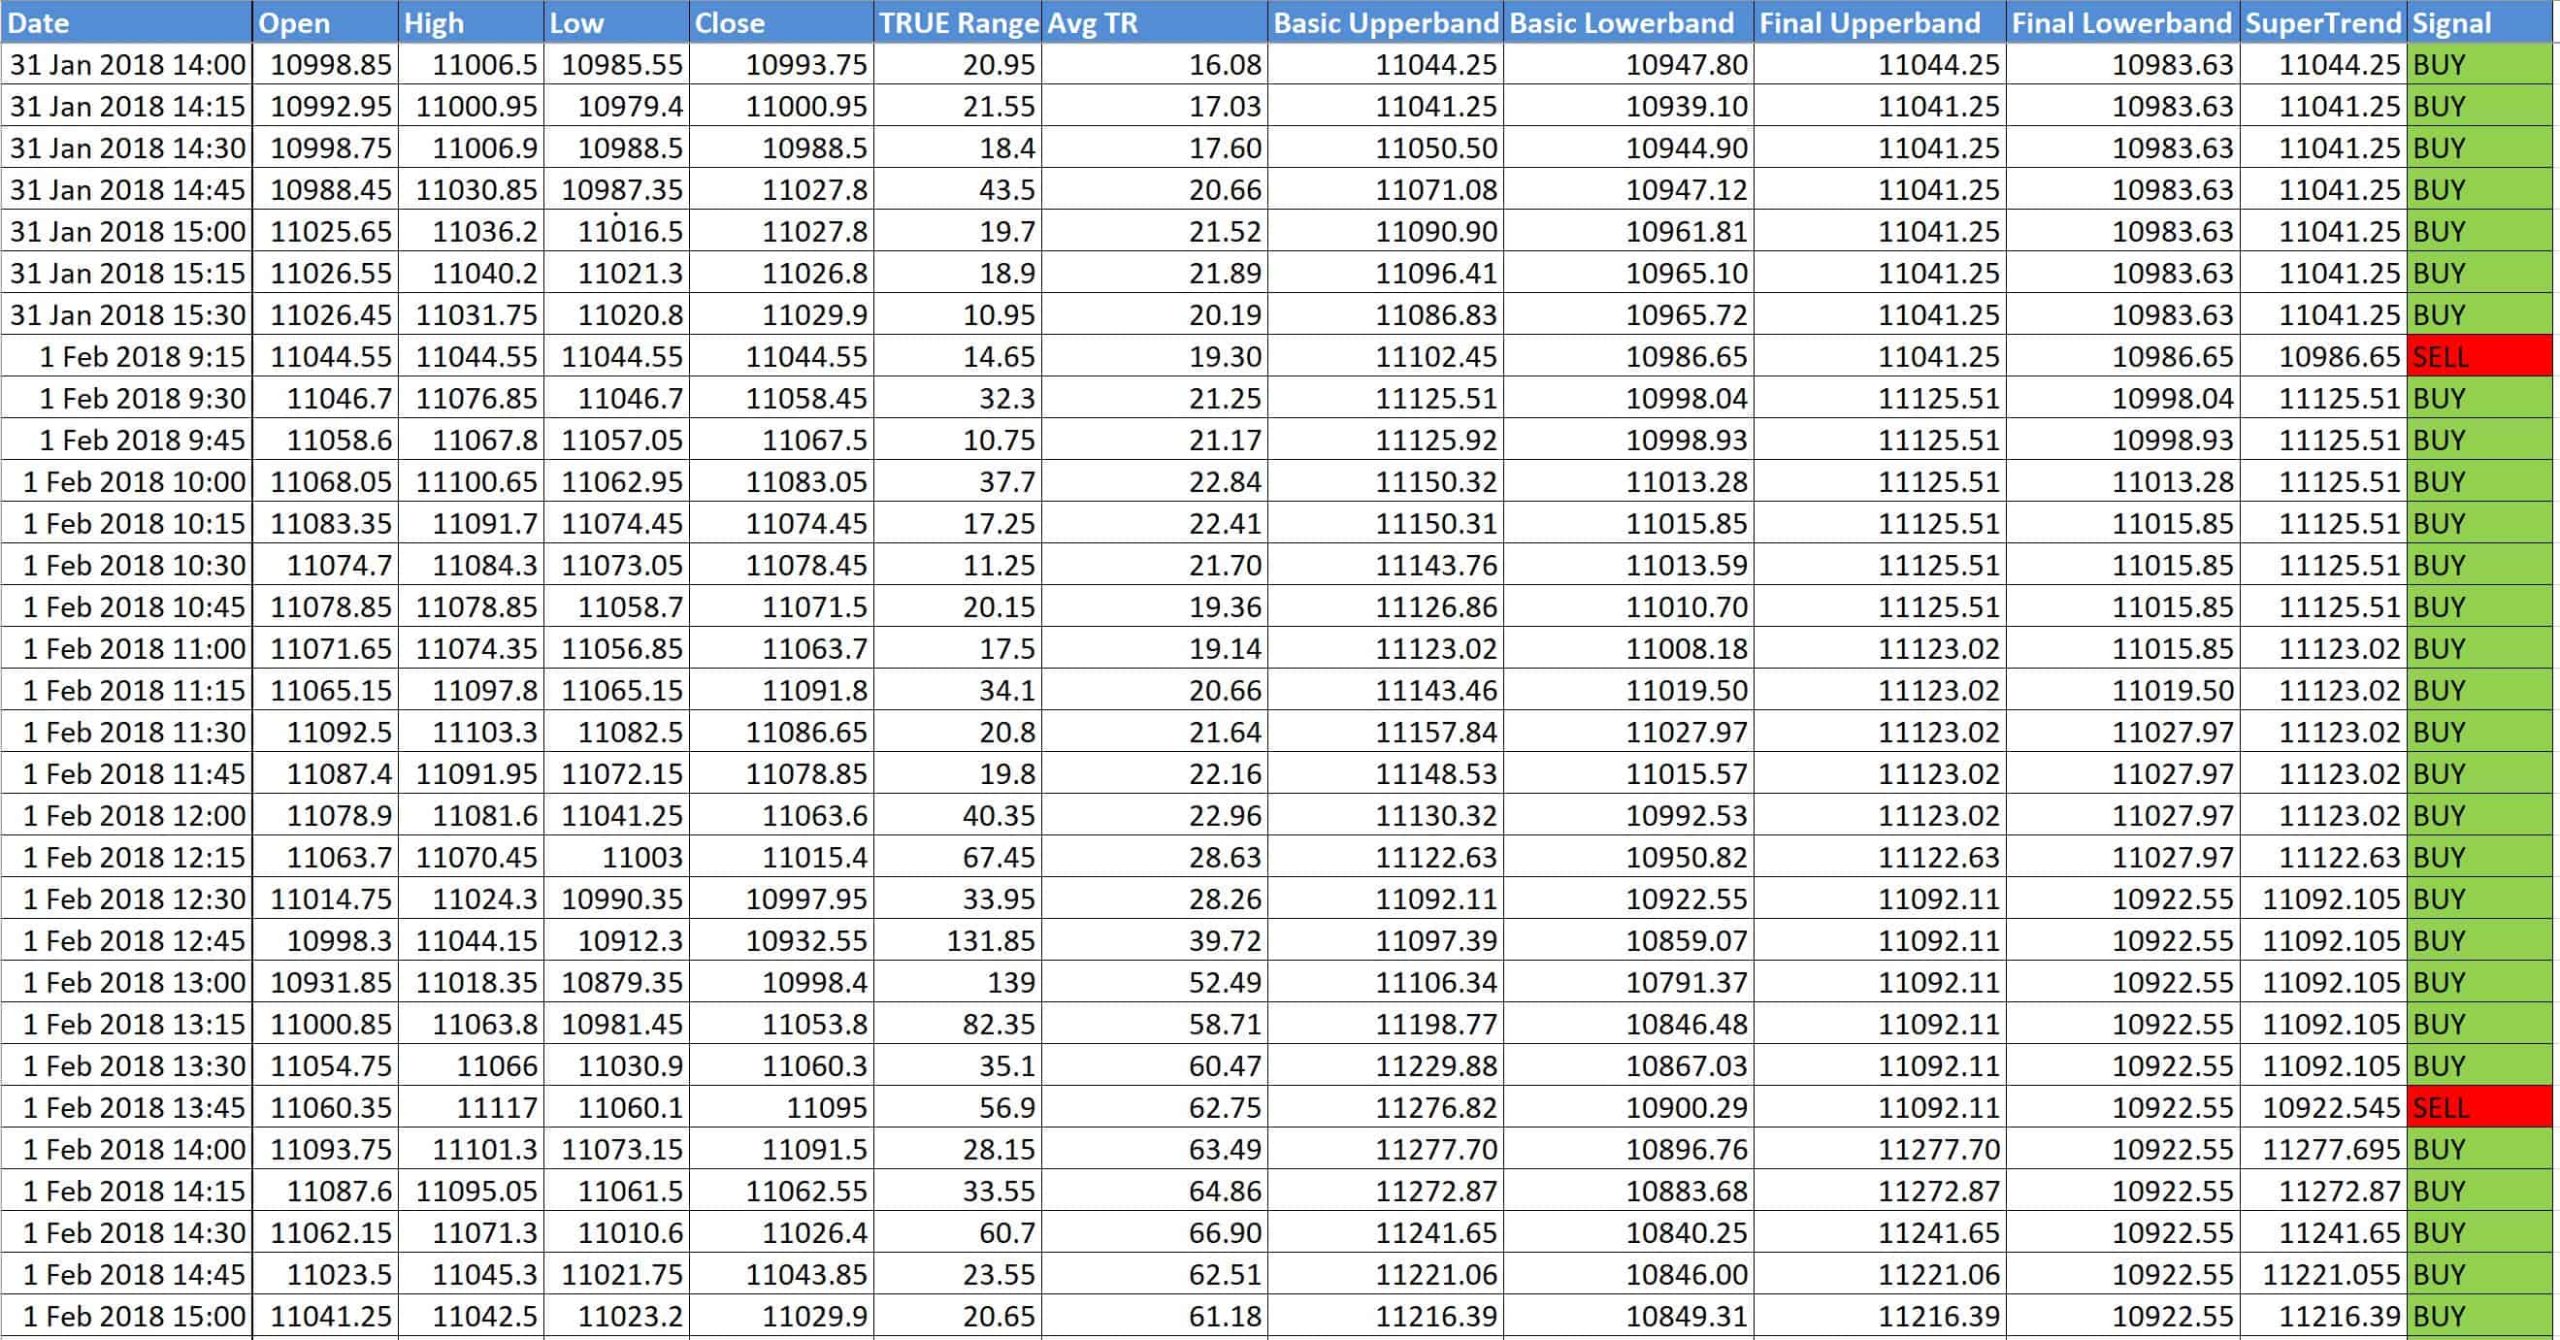
Here are the formulas that drive the Supertrend indicator:
- True Range (TR) = Max of (High-Low, High-Close, Low-Close)
- Average True Range (ATR) = Average of last n TR values (where n is a parameter in Supertrend indicator, usually 10)
- Basic Upperband = (High + Low) / 2 + Multiplier * ATR
- Basic Lowerband = (High + Low) / 2 – Multiplier * ATR
- Final Upperband = IF( (Current Basic Upperband < Previous Final Upperband) and (Previous Close > Previous Final Upperband)) Then (Current Basic Upperband) ELSE Previous Final Upperband
- Final Lowerband = IF( (Current Basic Lowerband > Previous Final Lowerband) and (Previous Close < Previous Final Lowerband)) Then (Current Basic Lowerband) ELSE Previous Final Lowerband
- SUPERTREND = IF(Current Close <= Current Final Upperband ) Then Current Final Upperband ELSE Current Final Lowerband
Seems tricky? No worries, we’ve got an automated excel sheet to do the math with real-time stock market data.
Sneak Peek of the Supertrend Indicator Excel Sheet
This automated spreadsheet effortlessly calculates Supertrend value and Buy/Sell signals for the entered symbol. No manual work needed!
Take a look at the screenshots below:

 Also Explore: Trading Success with ADX Indicator
How to Ride the Excel Sheet
Step 1: Grab the Excel file download at the end of this post.
Step 2: Open the Excel file, ensure you’re online. Say yes if it asks to enable Macros and Data connections.
Step 3: Key in the Symbol Name, Exchange Name, Interval, Number of Days, ATR Periods, Multiplier calculation method
Step 4: Click on Get Data. The data will download automatically and Supertrend values will appear. You can download data for up to 15 days with a minimum interval of 1 minute.
Download Your Supertrend Indicator Excel Sheet
Click the link below to download the Supertrend indicator excel sheet. We welcome your feedback and comments.