

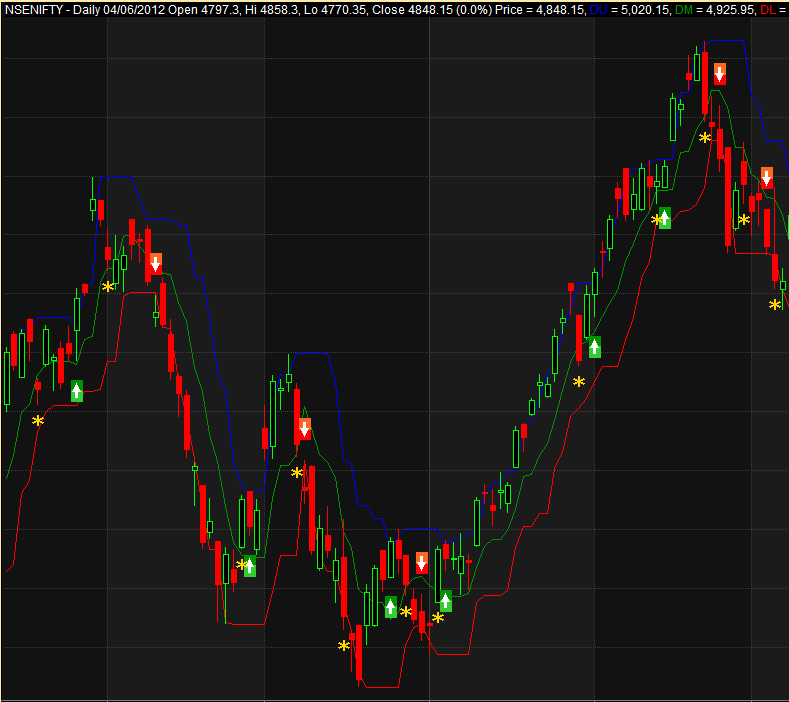
Screenshot of the AFL
| Parameter | Value | |
| Nifty | Bank Nifty | |
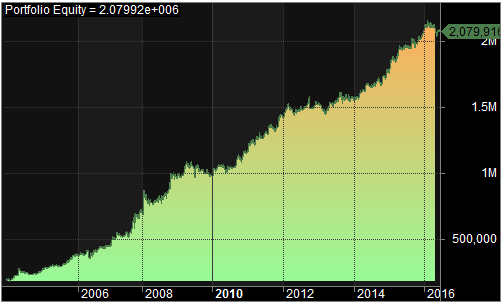
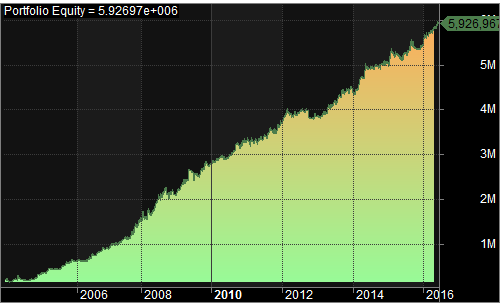
| Initial Capital | 200,000 | 200,000 |
| Final Capital | 2,079,916.00 | 5,926,967.00 |
| Backtest Period | 01-Jan-2004 to 20-Jun-2016 | 01-Jan-2004 to 20-Jun-2016 |
| Net Profit % | 939.96% | 2863.48% |
| Annual Return % | 20.66% | 31.23% |
| Number of Trades | 470 | 456 |
| Winning Trade % | 46.17% | 48.03% |
| Average Holding Period | 5.40 periods | 5.48 periods |
| Max Consecutive Losses | 7 | 7 |
| Max System % Drawdown | -17.15% | -40.04% |
| Max Trade % Drawdown | -18.70% | -14.52% |
Access the detailed backtest report here.
Nifty:
Bank Nifty:
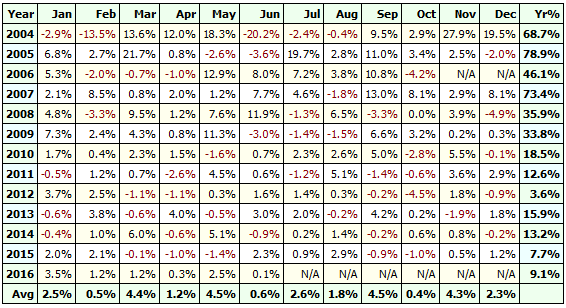
Additionally, explore the profit table for BankNifty below. This strategy consistently delivers robust performance each year:
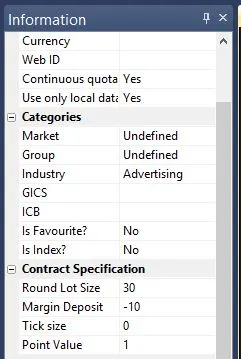
Visit Symbol–>Information to specify the lot size and margin requirements. The screenshot below illustrates a lot size of 30 and a 10% margin requirement for Bank Nifty:


3 Comments