

The Sharpe Ratio is a key tool for evaluating the performance of trading systems or mutual funds. Represented as a decimal, it reveals the consistency and sustainability of investment returns over time. In this article, we delve deep into the Sharpe Ratio, including its calculation, and offer a downloadable Sharpe Ratio calculator excel sheet for practical use.
Defining the Sharpe Ratio
The Sharpe Ratio quantifies the return of a trading system compared to a risk-free return and its volatility. As a comparative measure, it’s most meaningful when assessing multiple systems, as it has limited value in isolation.
Conceived by Nobel Prize winner William F. Sharpe, this ratio is a crucial factor in evaluating investment performance. Depending solely on absolute returns can be misleading due to potential drawdowns. It addresses this by incorporating risk (volatility) alongside return.
The effectiveness of a system improves with a higher Sharpe Ratio, achievable through high returns and low volatility.
Further Reading: Black Scholes Options Premium Calculator Spreadsheet
Calculating the Sharpe Ratio
Here’s the formula for the Sharpe Ratio:
Sharpe Ratio = (Rp – Rf)/σp
where
Rp = System Return (in %)
Rf = Risk-Free return rate (in %)
σp = Standard Deviation (in %)
For a risk-free return rate, US treasury bill yield or Bank fixed deposit rates are common references, typically ranging from 2% to 6%, depending on your location.
Both Rp and σp are based on series calculations, not single values. For example, if daily returns for 30 days are recorded, Rp is the average of these returns, and σp is their standard deviation. This becomes clearer with our Excel sheet for calculations.
Essentially, the Sharpe Ratio divides two key metrics:
- Difference between your system’s returns and the risk-free return rate.
- The standard deviation of the system’s returns over a specified period.
Illustrative Example:
Imagine your trading system’s annual returns over five years are 15%, 13%, 10%, 12%, and 10%.
Rp = (15+13+10+12+10)/5 = 12%
Assuming a risk-free return of 4%.
Then, Excess return = 12 – 4 = 8%
The standard deviation is the square root of the variance, calculated from each year’s return variance relative to the average. In this case, the variance is approximately 4.5, leading to a standard deviation of around 2.121.
Dividing the excess return by the standard deviation gives the Sharpe Ratio.
Sharpe Ratio = 8/2.121 = 3.77
Also Explore: K-Ratio: Evaluating Your Trading System’s Health
Sharpe Ratio Excel Calculator
Understanding the importance of the Sharpe Ratio in trading system assessment is one thing, but calculating it can be complex. Modern backtesting engines like Amibroker include it in their reports to simplify this task.
For those who prefer spreadsheets, we’ve developed a calculator in Excel. Just enter your net return percentages, and Excel takes care of the rest. The sheet includes sample yearly return data for demonstration, which you can modify as needed.
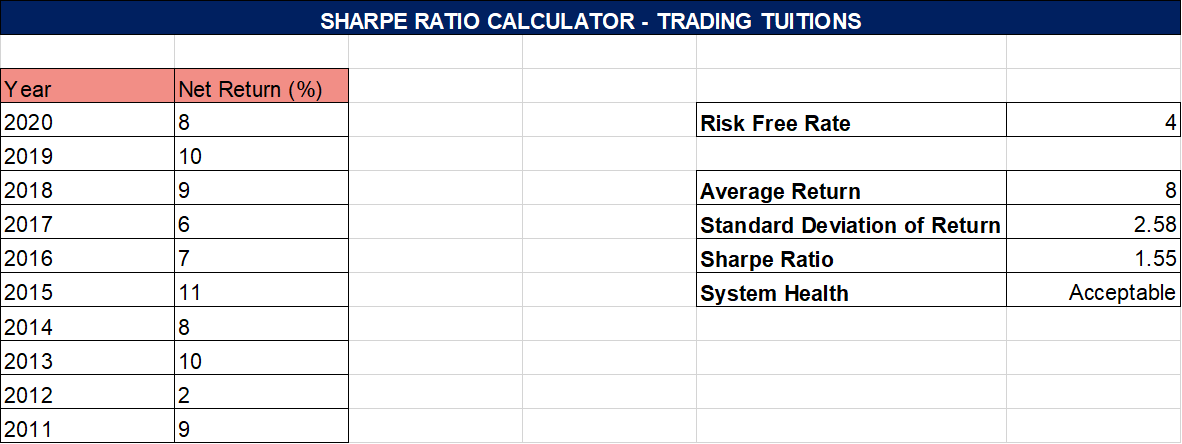
The risk-free rate is set at 4% but is adjustable. Standard deviation calculation uses Excel’s stddev() function.
The calculator also provides a system health rating based on the Sharpe Ratio:
1 – 1.99 Acceptable
2 – 2.99 Great
Above 3 Excellent
Download the Excel sheet here:


3 Comments