

The Correlation Matrix is a crucial tool for crafting a balanced and diverse investment portfolio. Understanding the exact correlation between stock prices is key to avoiding a collection of stocks that move in tandem. This post guides you through calculating the correlation matrix between various stocks using a simple spreadsheet.
For insights into calculating the correlation matrix of trading systems, check out this article.
First, let’s demystify what Correlation and a Correlation matrix are.
Understanding a Correlation Matrix
A correlation is a numerical measure (ranging from -1 to 1) that reveals the strength of the relationship between two stocks. In the context of stock prices:
- A score of 1 signifies a strong positive correlation.
- A score of -1 indicates a strong negative correlation.
- Zero means there’s no correlation whatsoever.
For instance:
A correlation of 1 implies that if Stock A moves up by 10 points, Stock B also moves up by the same amount. A correlation of 0.5 suggests a less strong, but still positive, relationship. Conversely, a correlation of -0.5 indicates an inverse relationship.
A correlation matrix arranges these correlations in a matrix format, providing a quick, visual representation of how different data points (in this case, stock prices) relate to one another.
Later in this article, we’ll explore an example of a correlation matrix.
Further Reading: Sharpe Ratio Calculator Excel Sheet
How is Correlation Computed?
Correlation is determined using standard deviation and covariance. It’s essentially the ratio of the covariance between two variables to the product of their standard deviations.
Cxy = Sxy / Sx*Sy
Here, Sx and Sy represent the sample standard deviations, and Sxy is the sample covariance.
This might recall memories of high school math or statistics classes. Fortunately, modern spreadsheet tools like MS Excel or Google Sheets simplify this process with built-in formulas for correlation. We’ll use these tools to create our stock correlation matrix.
Spreadsheet Overview for Correlation Matrix
We’ve designed a straightforward Google Sheets spreadsheet that fetches historical stock prices using Google Finance and calculates correlations between them.
Access the sheet here.
To use it, input the Stock symbols and historical days in Cells B3 to B8.
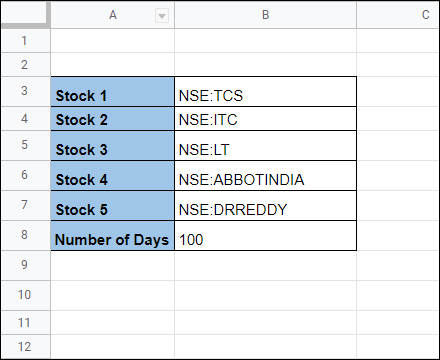
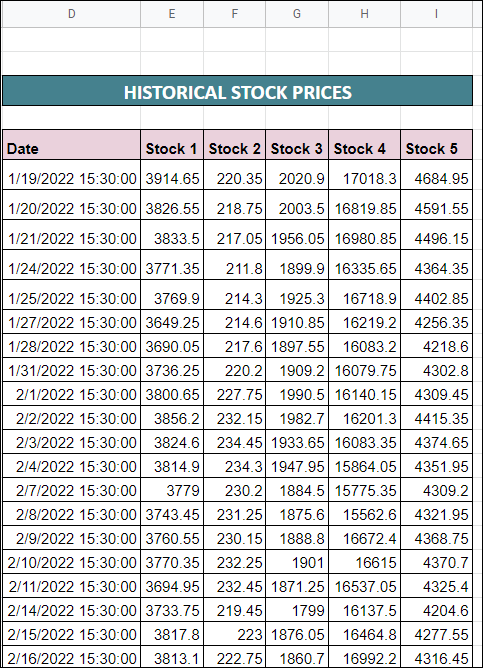
The sheet then automatically fetches historical prices from Google Finance into columns D to I.
Based on this data, the correlation matrix is calculated in columns K to P.
Each cell in the matrix uses the formula
to compute the correlation coefficient between two stocks.
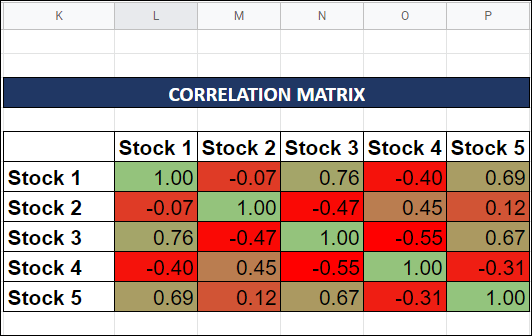
The color coding of the matrix ranges from Dark Red (for -1) to Dark Green (for +1), visually indicating the degree of correlation.
Experiment with the spreadsheet by altering stock symbols and historical days to see the dynamic updates in the correlation matrix.
Applying the Correlation Matrix
The correlation matrix primarily serves to help you diversify your portfolio. Consider the following matrix as an example:
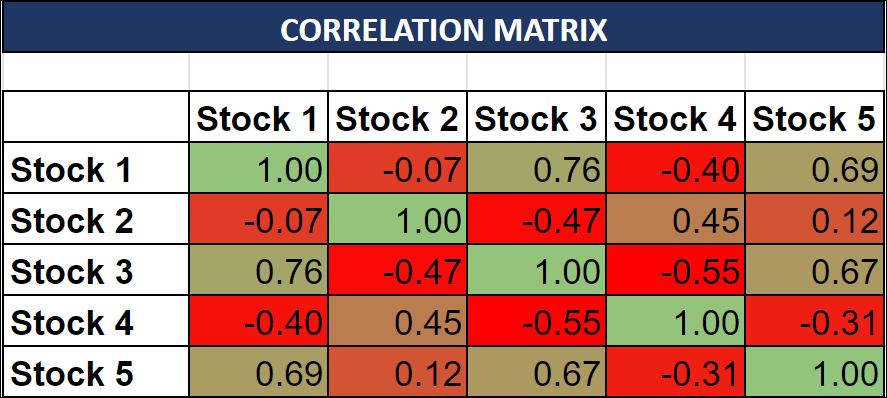
Here, the correlation between Stock 1 and Stock 2 is -0.07, indicating almost no correlation. This implies that fluctuations in Stock 1’s price have little to no impact on Stock 2, making them good diversification candidates.
Stock 1 to Stock 3 shows a high correlation of 0.76, suggesting their prices move similarly.
Beyond diversification, the correlation matrix can also inspire pair trading strategies. If historical correlations deviate, it could signal buy or sell opportunities. For more on this, visit this detailed article.
Try the spreadsheet from this link and share any questions in the comments section.


One Comment