

Creating a trading system today is straightforward. With basic computer and technical analysis skills, anyone can design a profitable system. But, does your system have what it takes to succeed over time? How does it stand out among the countless existing systems?
We’ve pinpointed 4 crucial parameters to Evaluate a Trading System, commonly found in any standard backtesting report.
Recommended Reading: Unraveling Amibroker Backtest Reports
1. Understanding Drawdown
Drawdown represents the potential capital loss in a system, usually shown as a percentage. It measures the maximum decline from peak to trough in your equity curve. For instance, if your capital dips from 10000 to 9000, the maximum drawdown is 1000 or 10%.
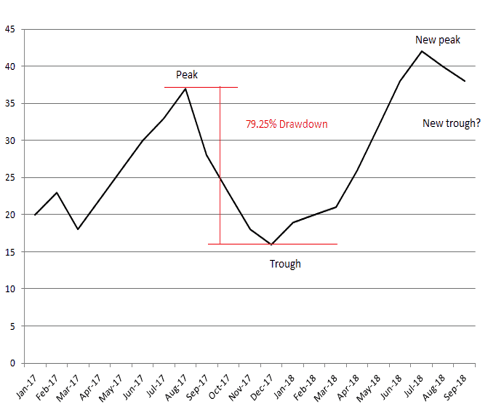
How to Calculate:
Max Drawdown = Peak Capital – Lowest Capital
Max Drawdown % = (Peak Capital – Lowest Capital)/Peak Capital * 100
Learn how to calculate drawdown in Excel: this guide.
“A lower max drawdown % indicates a stronger system.”
2. The Role of Average Risk-Reward Ratio
This ratio compares average losses to average profits, based on backtesting data. For example, if the average loss is 500 and the profit is 1000, the ratio is 1:2. This ratio influences the system’s success rate. With a 1:2 ratio, profitability is assured with a 33% win rate. Lowering this ratio further reduces the break-even success rate.
Formula:
Average Risk-Reward Ratio = Average Loss/Average Profit
Discover the importance of risk-reward ratio: Risk Reward Ratio: A Key to Success in the Stock Market.
“A lower risk-reward ratio signifies a more efficient system.”
3. Assessing Maximum Losing Streak
The maximum consecutive losses a system can incur, while not directly impacting overall performance, play a crucial role psychologically. Traders usually favor systems with a losing streak no less than 5.
Here’s an example of maximum losing streak calculations:
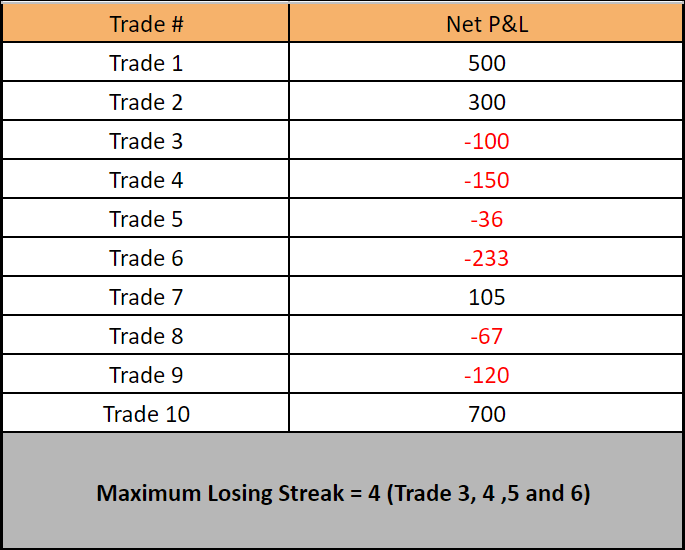
“A maximum losing streak should ideally not exceed 5.”
4. The Significance of Sharpe Ratio
We believe the Sharpe ratio is the finest method to judge a trading system. It compares average returns, adjusted for risk, allowing for comparison across varied risk profiles. It’s calculated by subtracting risk-free return from overall return, then dividing by standard deviation.
Sharpe ratio helps understand:
- Comparison against risk-free return rates like treasury bonds or bank FD interest rates.
- The system’s volatility, assessed using standard deviation of returns.
Calculating Sharpe Ratio:
Sharpe Ratio = (Rp – Rf)/σp
where
- Rp = System Return (in %)
- Rf = Risk-Free Return Rate (in %)
- σp = Standard Deviation (in %)
“A Sharpe ratio below 2 is suboptimal; higher ratios indicate better performance.”
Deep dive into the Sharpe ratio and access a free calculator: this article.
All these metrics are available in Amibroker’s backtest report.
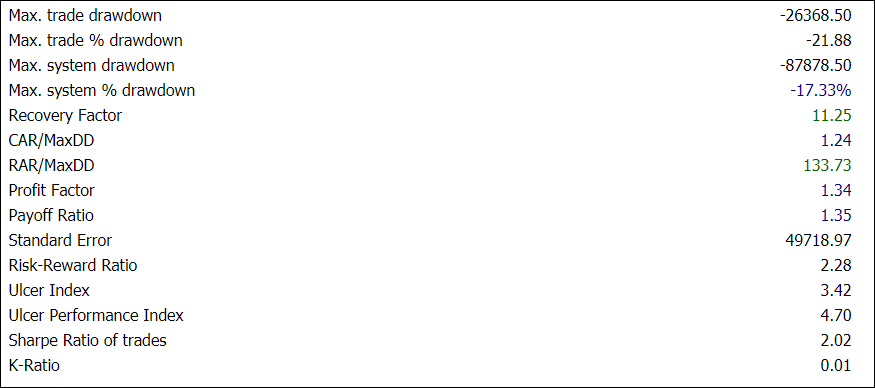
Besides these four, consider other metrics like CAGR, Expectancy, K-Ratio, Ulcer Index for a comprehensive evaluation of Evaluate a Trading System. Prioritize systems based on the main four parameters before delving into these additional metrics.


One Comment