
Linear Regression Trading: A Comprehensive Guide

In the world of finance, Linear Regression offers valuable insights and tools for predicting price movements in various markets. Discover the power of Linear Regression and its applications in trading systems used by hedge funds and institutional investors.

If you’re interested in mastering Linear Regression Trading and its connection to Mean reversion, you’re in the right place. We’ll break down Linear Regression and the Linear Regression channel in simple terms to help you get started.

Looking to learn AFL coding and create your own trading systems? Click here for a wealth of resources.

Understanding Linear Regression Line and Linear Regression Channel

The Linear Regression line is a powerful tool that offers a ‘best-fit’ line, providing insights into fair market value. Learn how deviations from this line reveal potential price trends and deviations in your charts.

The Linear Regression channel goes a step further, helping you identify overbought and oversold areas through the use of standard deviations. Gain a deeper understanding of this tool’s significance in developing mean reversion strategies.

See the Linear Regression channel in action:

Linear-Regression-Channel

An Overview of the Linear Regression Trading System – AFL

ParameterValue
Preferred Time-frameHourly
Indicators UsedLinear Regression, Standard Deviation
Buy Condition
  • The first candle closes below the lower band of the Linear Regression channel.
  • The second candle closes above the lower band.
  • The third candle closes above the second candle.
Short Condition
  • The first candle closes above the upper band of the Linear Regression channel.
  • The second candle closes below the upper band.
  • The third candle closes below the second candle.
Sell Condition
  • Same as Short
  • Triggered Stop Loss
  • Met Target
  • End of the trading day
Cover Condition
  • Same as Buy
  • Triggered Stop Loss
  • Met Target
  • End of the trading day
Stop Loss0.5%
Targets0.5%
Position Size100% of Equity
Initial Equity200,000
Brokerage100 per order
Margin10%

Linear Regression Trading System – AFL Code

				
					//------------------------------------------------------
//
//  Formula Name:    Linear Regression
//  Website:         https://zerobrokerageclub.com/
//------------------------------------------------------

_SECTION_BEGIN("Linear Regression");

SetTradeDelays( 1, 1, 1, 1 );
SetOption( "InitialEquity", 200000);
SetOption("FuturesMode" ,True);
SetOption("MinShares",1);
SetOption("CommissionMode",2);
SetOption("CommissionAmount",100);
SetOption("AccountMargin",10);
SetOption("RefreshWhenCompleted",True);
SetPositionSize(100,spsPercentOfEquity);
SetOption( "AllowPositionShrinking", True );
BuyPrice=Open;
SellPrice=Open;
ShortPrice=Open;
CoverPrice=Open;

SetChartOptions(0,chartShowArrows|chartShowDates);
_N(Title = StrFormat("{{NAME}} – {{INTERVAL}} {{DATE}} Open %g, Hi %g, Lo %g, Close %g (%.1f%%) {{VALUES}}", O, H, L, C, SelectedValue( ROC( C, 1 ) ) ));
Plot( Close, "Price", colorWhite, styleCandle );

P = ParamField("Price field",-1);
Periods = Param("Periods", 20, 2, 300, 1, 10 );
Plot( LinearReg( P, Periods ), _DEFAULT_NAME(), ParamColor( "Color", colorCycle ), ParamStyle("Style") ); 
_SECTION_END();

NewDay = (Day()!= Ref(Day(), -1)) OR BarIndex() == 0;  
//Plot(NewDay,"",colorlightGrey,styleHistogram|styleDots|styleNoLabel|styleOwnScale);

FirstTradeTime=093000;
SquareOffTime = 151500;

LR = LinearReg(C,20);
SD = StDev(C,20);
up = LR + 2*SD;
down = LR - 2*SD;

Plot(up,"UP",colorRed);
Plot(down,"DOWN",colorGreen);


Buy = Ref(C,-2) < Ref(down,-2) AND Ref(C,-1)>Ref(down,-1) AND C>Ref(C,-1) AND TimeNum()>= FirstTradeTime AND TimeNum()<SquareOffTime;
Short = Ref(C,-2) > Ref(up,-2) AND Ref(C,-1)<Ref(up,-1) AND C<Ref(C,-1) AND TimeNum()  >= FirstTradeTime and TimeNum()<SquareOffTime;
Sell=Short OR TimeNum() >= SquareOffTime;
Cover=Buy OR TimeNum() >= SquareOffTime;

Buy=ExRem(Buy,Sell);
Sell=ExRem(Sell,Buy);

Short=ExRem(Short,Cover);
Cover=ExRem(Cover,Short);

StopLoss=Optimize("stop",0.5,0.5,3,0.5);
ApplyStop(Type=0,Mode=1,Amount=StopLoss);

Target=Optimize("Target",0.5,0.5,5,0.5);
ApplyStop(Type=1,Mode=1,Amount=Target);

printf("\nBuy : " + Buy );  
printf("\nSell : " + Sell );  
printf("\nShort : " + Short );  
printf("\nCover : " + Cover ); 


/* Plot Buy and Sell Signal Arrows */
PlotShapes(IIf(Buy, shapeSquare, shapeNone),colorGreen, 0, L, Offset=-40);
PlotShapes(IIf(Buy, shapeSquare, shapeNone),colorLime, 0,L, Offset=-50);
PlotShapes(IIf(Buy, shapeUpArrow, shapeNone),colorWhite, 0,L, Offset=-45);
PlotShapes(IIf(Cover, shapeSquare, shapeNone),colorGreen, 0, L, Offset=-40);
PlotShapes(IIf(Cover, shapeSquare, shapeNone),colorLime, 0,L, Offset=-50);
PlotShapes(IIf(Cover, shapeUpArrow, shapeNone),colorWhite, 0,L, Offset=-45);
PlotShapes(IIf(Sell, shapeSquare, shapeNone),colorRed, 0, H, Offset=40);
PlotShapes(IIf(Sell, shapeSquare, shapeNone),colorOrange, 0,H, Offset=50);
PlotShapes(IIf(Sell, shapeDownArrow, shapeNone),colorWhite, 0,H, Offset=-45);
PlotShapes(IIf(Short, shapeSquare, shapeNone),colorRed, 0, H, Offset=40);
PlotShapes(IIf(Short, shapeSquare, shapeNone),colorOrange, 0,H, Offset=50);
PlotShapes(IIf(Short, shapeDownArrow, shapeNone),colorWhite, 0,H, Offset=-45);


_SECTION_END();


AFL Screenshot

Explore the Linear Regression Trading System in AFL. Take a closer look at its implementation through the provided code.

Linear-Regression-Trading-System

For more insights into trading systems, don’t miss out on the Donchian Channel Trend following system.

Linear Regression Trading System – Backtest Report

Uncover the performance of the Linear Regression Trading System. While it may not promise astronomical returns, its consistent performance and low drawdown make it a suitable choice for intraday scalping.

ParameterValue
Nifty
Initial Capital200,000
Final Capital736,893.90
Scrip NameNSE Nifty
Backtest Period26-Feb-2008 to 30-Jun-2017
TimeframeHourly
Net Profit %268.45%
Annual Return %14.71%
Number of Trades136
Winning Trade %55.88%
Average Holding Period3.05 periods
Max Consecutive Losses4
Max System % Drawdown-13.37%
Max Trade % Drawdown-13.86%

Download the detailed backtest report here.

Equity Curve

Take a look at the smooth and stable equity curve, reflecting the Linear Regression Trading System’s performance.

Linear-Regression-Equity-Curve

Profit Table

Gain insights from the profit table, providing a clear overview of the system’s performance and results.

Linear-Regression-Profit-Table

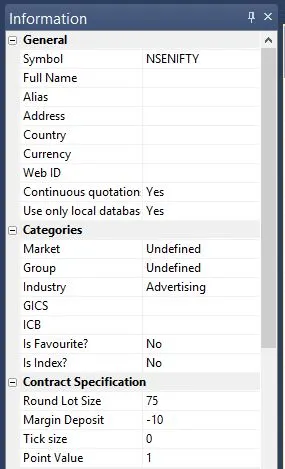
Additional Amibroker Settings for Backtesting

Optimize your trading experience by configuring Amibroker settings for backtesting. Explore symbol information, lot size, and margin requirements for NSE Nifty.

Symbol-Info_Nifty

Leave a Reply