
In AFL section, we’ve mainly discussed strategies that follow trends in the market. However, we tried something different and experimented with a Mean Reversion Trading System, and we were really impressed by how accurate it was and the returns it generated. In this post, we’ll explore this unique system and take a close look at how it performed in historical testing with NSE Nifty. To start, let’s get a clear grasp of what the Mean Reversion system is all about.
Mean Reversion systems operate on the premise that stock prices fluctuate within a predefined range bounded by upper and lower price bands. Prices tend to gravitate toward a median level over time. To trade such a system, a Buy order is placed at the lower end of the range, while a Sell order is placed at the upper end. It’s crucial to exercise caution during any breakout from this range, particularly when accompanied by high trading volumes. Implementing a strict stop-loss strategy is essential when trading Mean Reversion systems. Various indicators can be useful for developing Mean Reversion Trading systems, such as Bollinger Bands, Donchian channels, RSI, and CCI, among others.
For AFL coding tutorials and creating your own trading systems, please visit this link.
| Parameter | Value |
| Preferred Timeframe | Intraday 5 minute |
| Indicators Used | Bollinger Band, ADX |
| Buy Condition |
|
| Short Condition |
|
| Sell Condition |
|
| Cover Condition |
|
| Stop Loss | 0.5% |
| Targets | 1% |
| Position Size | 150 (fixed) |
| Initial Equity | 200,000 |
| Brokerage | 100 per order |
| Margin | 10% |
AFL Code
//------------------------------------------------------
// Formula Name: Mean Reversion Trading System
// Website: zerobrokerageclub.com
//------------------------------------------------------
_SECTION_BEGIN("Mean Reversion Trading System");
SetChartOptions(0,chartShowArrows|chartShowDates);
_N(Title = StrFormat("{{NAME}} – {{INTERVAL}} {{DATE}} Open %g, Hi %g, Lo %g, Close %g (%.1f%%) {{VALUES}}", O, H, L, C, SelectedValue( ROC( C, 1 ) ) ));
SetTradeDelays( 1, 1, 1, 1 );
SetOption( "InitialEquity", 200000);
SetOption("FuturesMode" ,True);
SetOption("MinShares",1);
SetOption("CommissionMode",2);
SetOption("CommissionAmount",100);
SetOption("AccountMargin",10);
SetOption("RefreshWhenCompleted",True);
SetPositionSize(150,spsShares);
SetOption( "AllowPositionShrinking", True );
BuyPrice=Open;
SellPrice=Open;
ShortPrice=Open;
CoverPrice=Open;
Periods =optimize("Periods",110,10,200,20);
Width =optimize("width",2,1,10,1);
MAPeriods = 200;
BBColor = colorOrange;
Style = 0;
bTop=BBandTop( Close, Periods, Width );
bBottom=BBandBot( Close, Periods, Width );
ADXPeriods=optimize("ADXPeriods",10,2,20,1);
BuyCondition=IIf(Ref(C,-1)<bBottom AND close>bBottom AND ADX(ADXPeriods)<35,1,0);
ShortCondition=IIf(Ref(C,-1)>bTop AND close<bTop AND ADX(ADXPeriods)<35,1,0);
Buy = IIf(Ref(C,-1)<bBottom AND close>bBottom AND ADX(ADXPeriods)<35,1,0);
Short = IIf(Ref(C,-1)>bTop AND close<bTop AND ADX(ADXPeriods)<35,1,0);
BarsSinceBuy=BarsSince(BuyCondition);
BarsSinceShort=BarsSince(ShortCondition);
LastBuyPrice=ValueWhen(Buy AND BarsSinceBuy<BarsSinceShort,BuyPrice);
LastShortPrice=ValueWhen(Short AND BarsSinceShort<BarsSinceBuy,ShortPrice);
StopLoss=optimize("SL",0.5,0.2,1,0.2);
Target=optimize("Target",1,0.5,5,0.5);
BuySL=BarsSinceBuy<BarsSinceShort AND Close<=LastBuyPrice-LastBuyPrice*(Stoploss/100);
ShortSL=BarsSinceShort<BarsSinceBuy AND Close>=LastShortPrice+LastBuyPrice*(Stoploss/100);
BuyTarget=BarsSinceBuy<BarsSinceShort AND Close>=LastBuyPrice+LastBuyPrice*(Target/100);
ShortSL=BarsSinceShort<BarsSinceBuy AND Close<=LastShortPrice-LastBuyPrice*(Target/100);
Sell=Short OR Close<bBottom OR BuySL OR BuyTarget;
Cover=Buy OR Close>bTop OR ShortSL OR BuyTarget;
Buy = ExRem(Buy,Sell);
Sell = ExRem(Sell,Buy);
Short=ExRem(Short,Cover);
Cover=ExRem(Cover,Short);
ApplyStop(Type=0,Mode=1,Amount=StopLoss);
ApplyStop(Type=1,Mode=1,Amount=Target);
printf("\nBuy : " + Buy );
printf("\nShort : " + Short );
printf("\nCover : " + Cover );
printf("\nSell : " + Sell );
printf("\nBuyPrice : " + BuyPrice );
printf("\nShortPrice : " + ShortPrice );
printf("\nLastBuyPrice : "+ LastBuyPrice);
printf("\nLastShortPrice : "+ LastShortPrice);
printf("\nBuyCondition : "+ BuyCondition);
printf("\nShortCondition : "+ ShortCondition);
printf("\nBuySL : "+BuySL);
printf("\nShortSL : "+ShortSL);
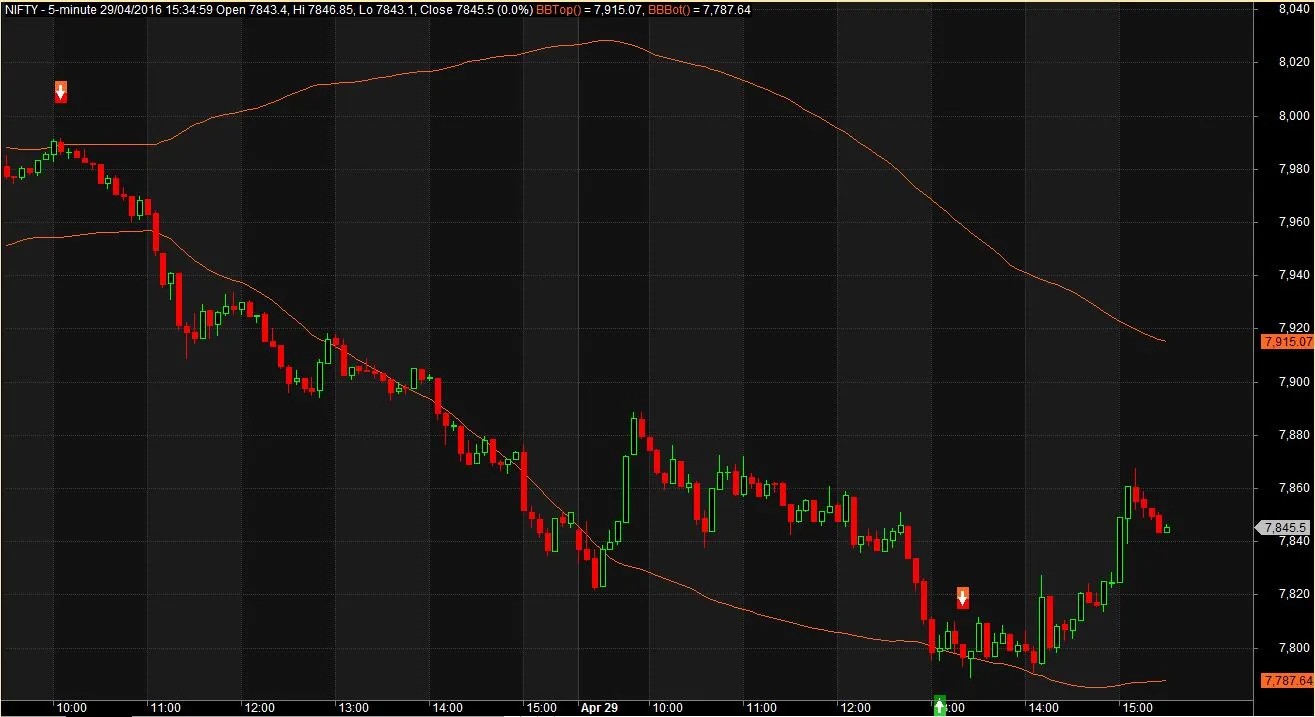
Plot( C, "Close", ParamColor("Color", colorDefault ), styleNoTitle | ParamStyle("Style") | GetPriceStyle() );
Plot( bTop, "BBTop" + _PARAM_VALUES(), BBColor , Style );
Plot( bBottom, "BBBot" + _PARAM_VALUES(), BBColor , Style );
/* Plot Buy and Sell Signal Arrows */
PlotShapes(IIf(Buy, shapeSquare, shapeNone),colorGreen, 0, L, Offset=-40);
PlotShapes(IIf(Buy, shapeSquare, shapeNone),colorLime, 0,L, Offset=-50);
PlotShapes(IIf(Buy, shapeUpArrow, shapeNone),colorWhite, 0,L, Offset=-45);
PlotShapes(IIf(Cover, shapeSquare, shapeNone),colorGreen, 0, L, Offset=-40);
PlotShapes(IIf(Cover, shapeSquare, shapeNone),colorLime, 0,L, Offset=-50);
PlotShapes(IIf(Cover, shapeUpArrow, shapeNone),colorWhite, 0,L, Offset=-45);
PlotShapes(IIf(Sell, shapeSquare, shapeNone),colorRed, 0, H, Offset=40);
PlotShapes(IIf(Sell, shapeSquare, shapeNone),colorOrange, 0,H, Offset=50);
PlotShapes(IIf(Sell, shapeDownArrow, shapeNone),colorWhite, 0,H, Offset=-45);
PlotShapes(IIf(Short, shapeSquare, shapeNone),colorRed, 0, H, Offset=40);
PlotShapes(IIf(Short, shapeSquare, shapeNone),colorOrange, 0,H, Offset=50);
PlotShapes(IIf(Short, shapeDownArrow, shapeNone),colorWhite, 0,H, Offset=-45);
_SECTION_END();
AFL Screenshot
Backtest Report
| Parameter | Value |
| Fixed Position Size | |
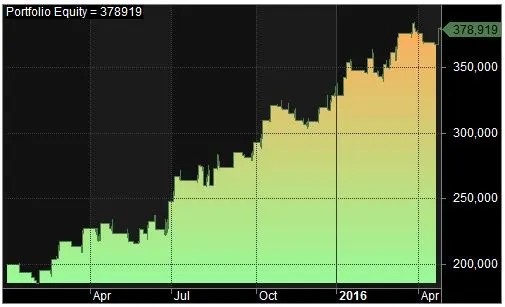
| Initial Capital | 200,000 |
| Final Capital | 378,919.40 |
| Scrip Name | NSE Nifty |
| Backtest Period | 14-Jan-2015 to 29-04-2016 |
| Timeframe | 5 Minutes |
| Net Profit % | 89.46% |
| Annual Return % | 61.91% |
| Number of Trades | 114 |
| Winning Trade % | 32.46% |
| Average Holding Period | 25.17 periods |
| Max Consecutive Losses | 9 |
| Max System % Drawdown | -10.78% |
| Max Trade % Drawdown | -7.95% |
You can find the detailed backtest report here
Equity Curve
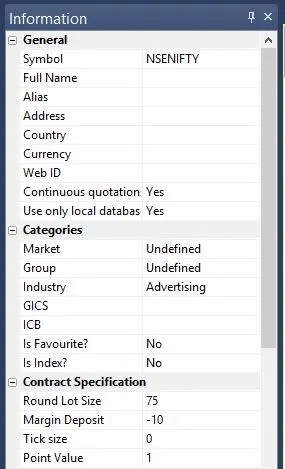
Additional Amibroker settings for backtesting
Navigate to Symbol → Information, and define the lot size and margin prerequisites. The image below illustrates a lot size of 75 and a 10% margin requirement for NSE Nifty:


3 Comments