

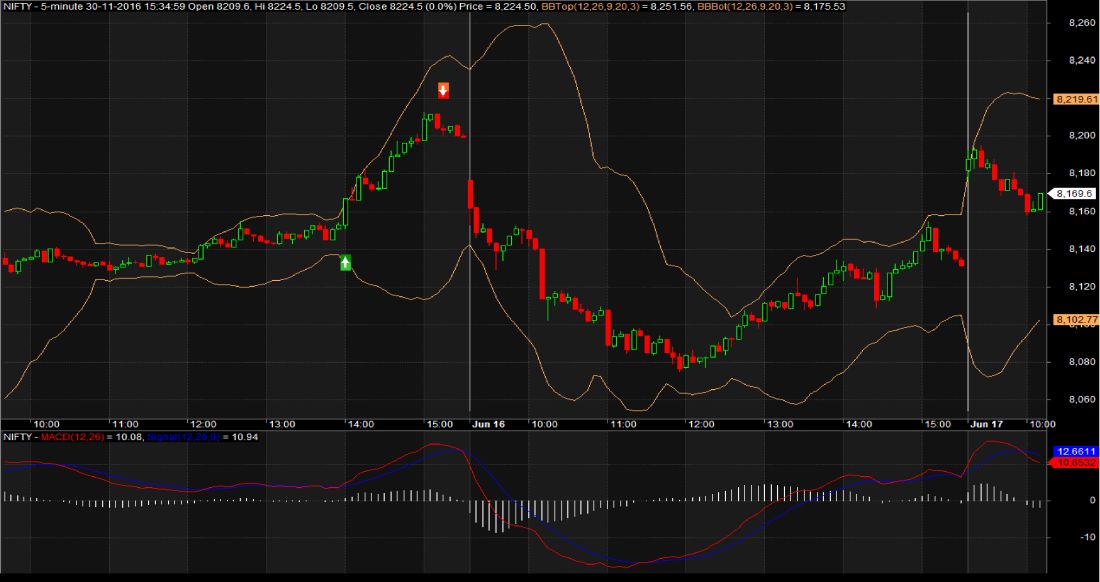
AFL Screenshot
Backtest Report Parameters for the Intraday Trend Following Strategy
| Parameter | Value |
| Nifty | |
| Initial Capital | 200,000 |
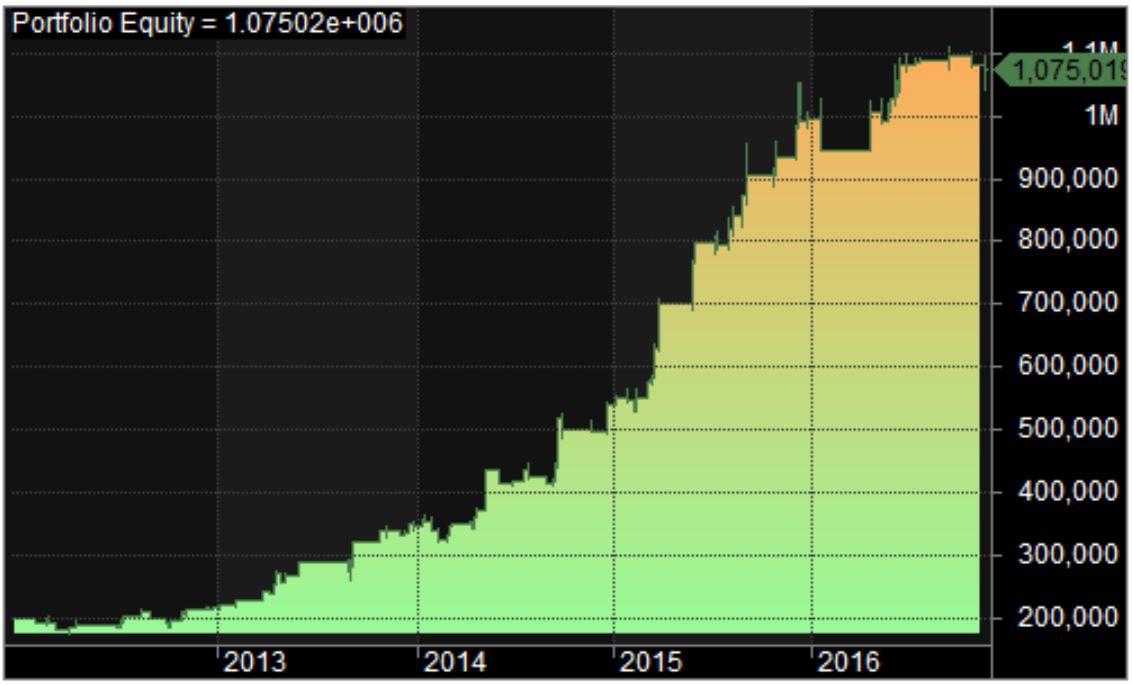
| Final Capital | 1,075,018.50 |
| Scrip Name | NSE Nifty |
| Backtest Period | 8-Feb-2012 to 21-Nov-2016 |
| Timeframe | 5 Minutes |
| Net Profit % | 437.51% |
| Annual Return % | 40.80% |
| Number of Trades | 106 |
| Winning Trade % | 67.92% |
| Average Holding Period | 24.20 periods |
| Max Consecutive Losses | 4 |
| Max System % Drawdown | -13.03% |
| Max Trade % Drawdown | -8.13% |
Equity Curve
Profit Table
This intraday trend following strategy has been profitable every year from 2012 to 2016.
Additional Amibroker Settings for Backtesting
Go to Symbol –> Information and specify the lot size and margin requirement. The screenshot below shows a lot size of 75 and a margin requirement of 10% for NSE Nifty.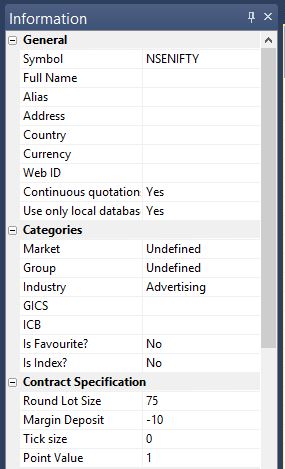


2 Comments