
Fibonacci Levels rank among the most widely used tools in the realm of Technical Analysis. These levels possess a predictive quality, aiding in the identification of pullbacks or breakouts. Over the years, people have harnessed their efficacy, particularly in the Forex market. Employing Fibonacci retracements in your trading endeavors won’t guarantee instant success. Nonetheless, when employed alongside other technical analysis indicators such as RSI, MACD, moving averages, candlestick patterns, and more, they can yield substantial value. In this article, we share an Excel sheet for Fibonacci Levels calculation. Please read on to grasp its application.
Simplifying the process further is possible by utilizing a Fibonacci retracement tool, a feature found in most trading platforms. When combined with other valuable tools, alongside your personal knowledge and experience, it can significantly enhance your trading outcomes.
Explore other popular Excel sheets featured in this blog section.
What Exactly is the Fibonacci Sequence?
The Fibonacci Sequence represents a series of numbers, where each number is the sum of the two preceding numbers. The initial ten numbers in the Fibonacci Sequence are: 0, 1, 1, 2, 3, 5, 8, 13, 21, 34. Fibonacci numbers also manifest in various aspects of nature, such as the arrangement of leaves on a stem and the branching of trees. Recently, this sequence has gained significant popularity in the financial markets.
Derived from the Fibonacci Sequence are a set of ratios, which carry special significance for traders as they offer insights into potential reversals or breakouts. The most crucial Fibonacci ratio is 61.8%, sometimes referred to as the “golden ratio” or “golden mean,” acknowledged as the most “reliable” retracement ratio. The Golden Ratio is determined by dividing any number in the sequence by the immediately following number. Regardless of the chosen number, the result is consistently very close to the mean average of 0.618, or 61.8%. For example:
- 8 divided by 13 = 0.615 = 61.5%
- 13 divided by 21 = 0.619 = 61.9%
- 21 divided by 34 = 0.617 = 61.7%
The other two Fibonacci Ratios employed by forex traders are 38.2% and 23.6%. While these ratios tend to have a lower success rate, they are still included for analytical purposes.
The 38.2% ratio is calculated by dividing any number in the sequence by the number situated two places to the right. For example:
- 8 divided by 21 = 0.380 = 38.0%
- 144 divided by 377 = 0.381 = 38.1%
- 6765 divided by 17,716 = 0.381 = 38.1%
In a similar manner, the 23.6% ratio involves dividing any number in the sequence by the number located three places to the right:
- 5 divided by 21 = 0.238 = 23.8%
- 34 divided by 144 = 0.236 = 23.6%
- 6765 divided by 28,667 = 0.235 = 23.5%
Additionally, most trading systems include retracement levels at 50% and 100%.
How to Apply Fibonacci Levels?
Fibonacci Levels can be broadly categorized into two types: Retracement levels and Extension levels. Retracement levels indicate the percentage of pullback or retrace before a return to the original trend. Conversely, Extension levels help determine the price target. In simpler terms, retracement levels offer insights into where to set your Stop Loss, while Extension levels aid in identifying profit targets.
Here is a visual representation of retracement:
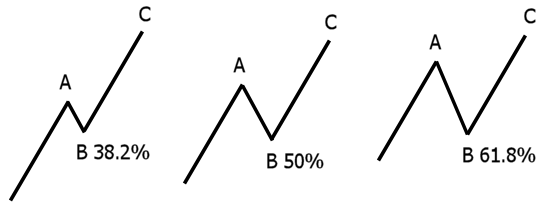
After an asset experiences an upward movement (A), it may retrace a portion of that movement (B) before continuing in the desired direction (C). As a swing trader, these retracements or pullbacks are what you should monitor when initiating long or short positions.
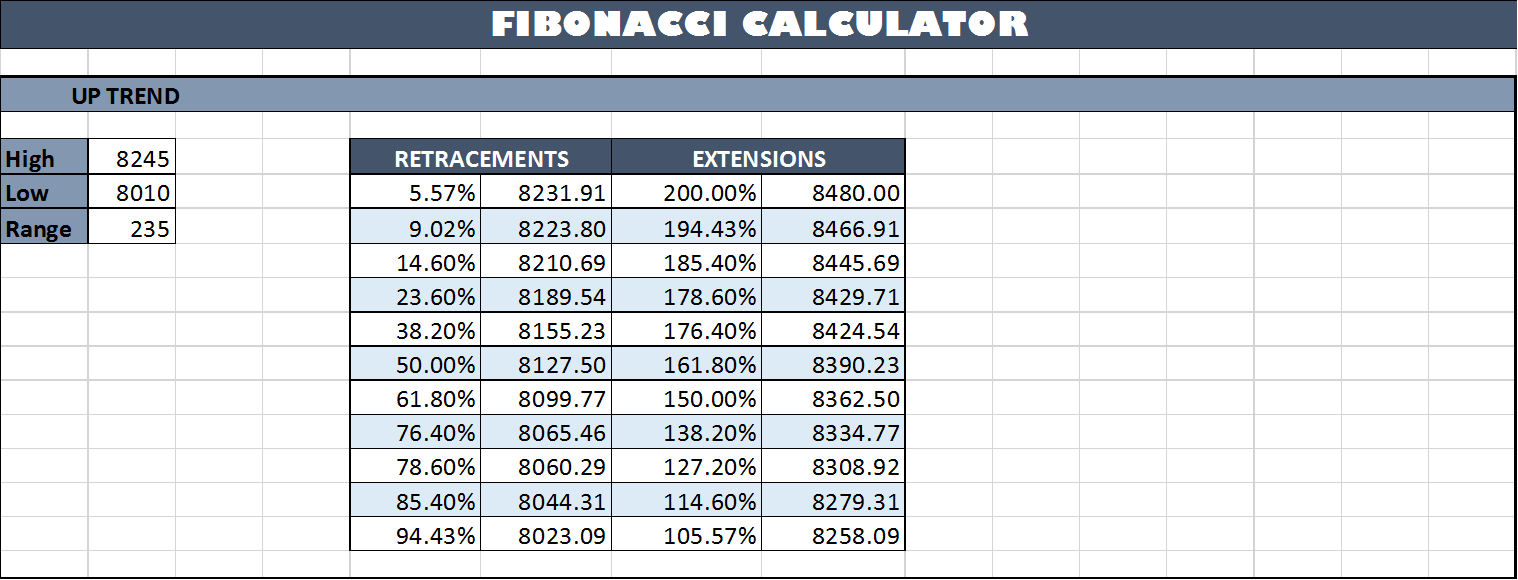
Excel Spreadsheet for Fibonacci Levels Calculation
| Parameter | Description | |
| Worksheet Name | Fibonacci Levels Calculator | |
| Inputs | Cell B5, B6, B20, B21 | High and Low values for the chosen stock in an uptrend and downtrend, respectively. These can represent weekly High and Low for Swing Trading or hourly High and Low for Intraday Trading. |
| Outputs | Cells E5:H16 | Retracement and Extension levels for an uptrend |
| Cells E20:H31 | Retracement and Extension levels for a downtrend | |
Screenshot
You can download the Excel sheet via the following link. Feel free to share any questions or queries in the comments section.


One Comment