

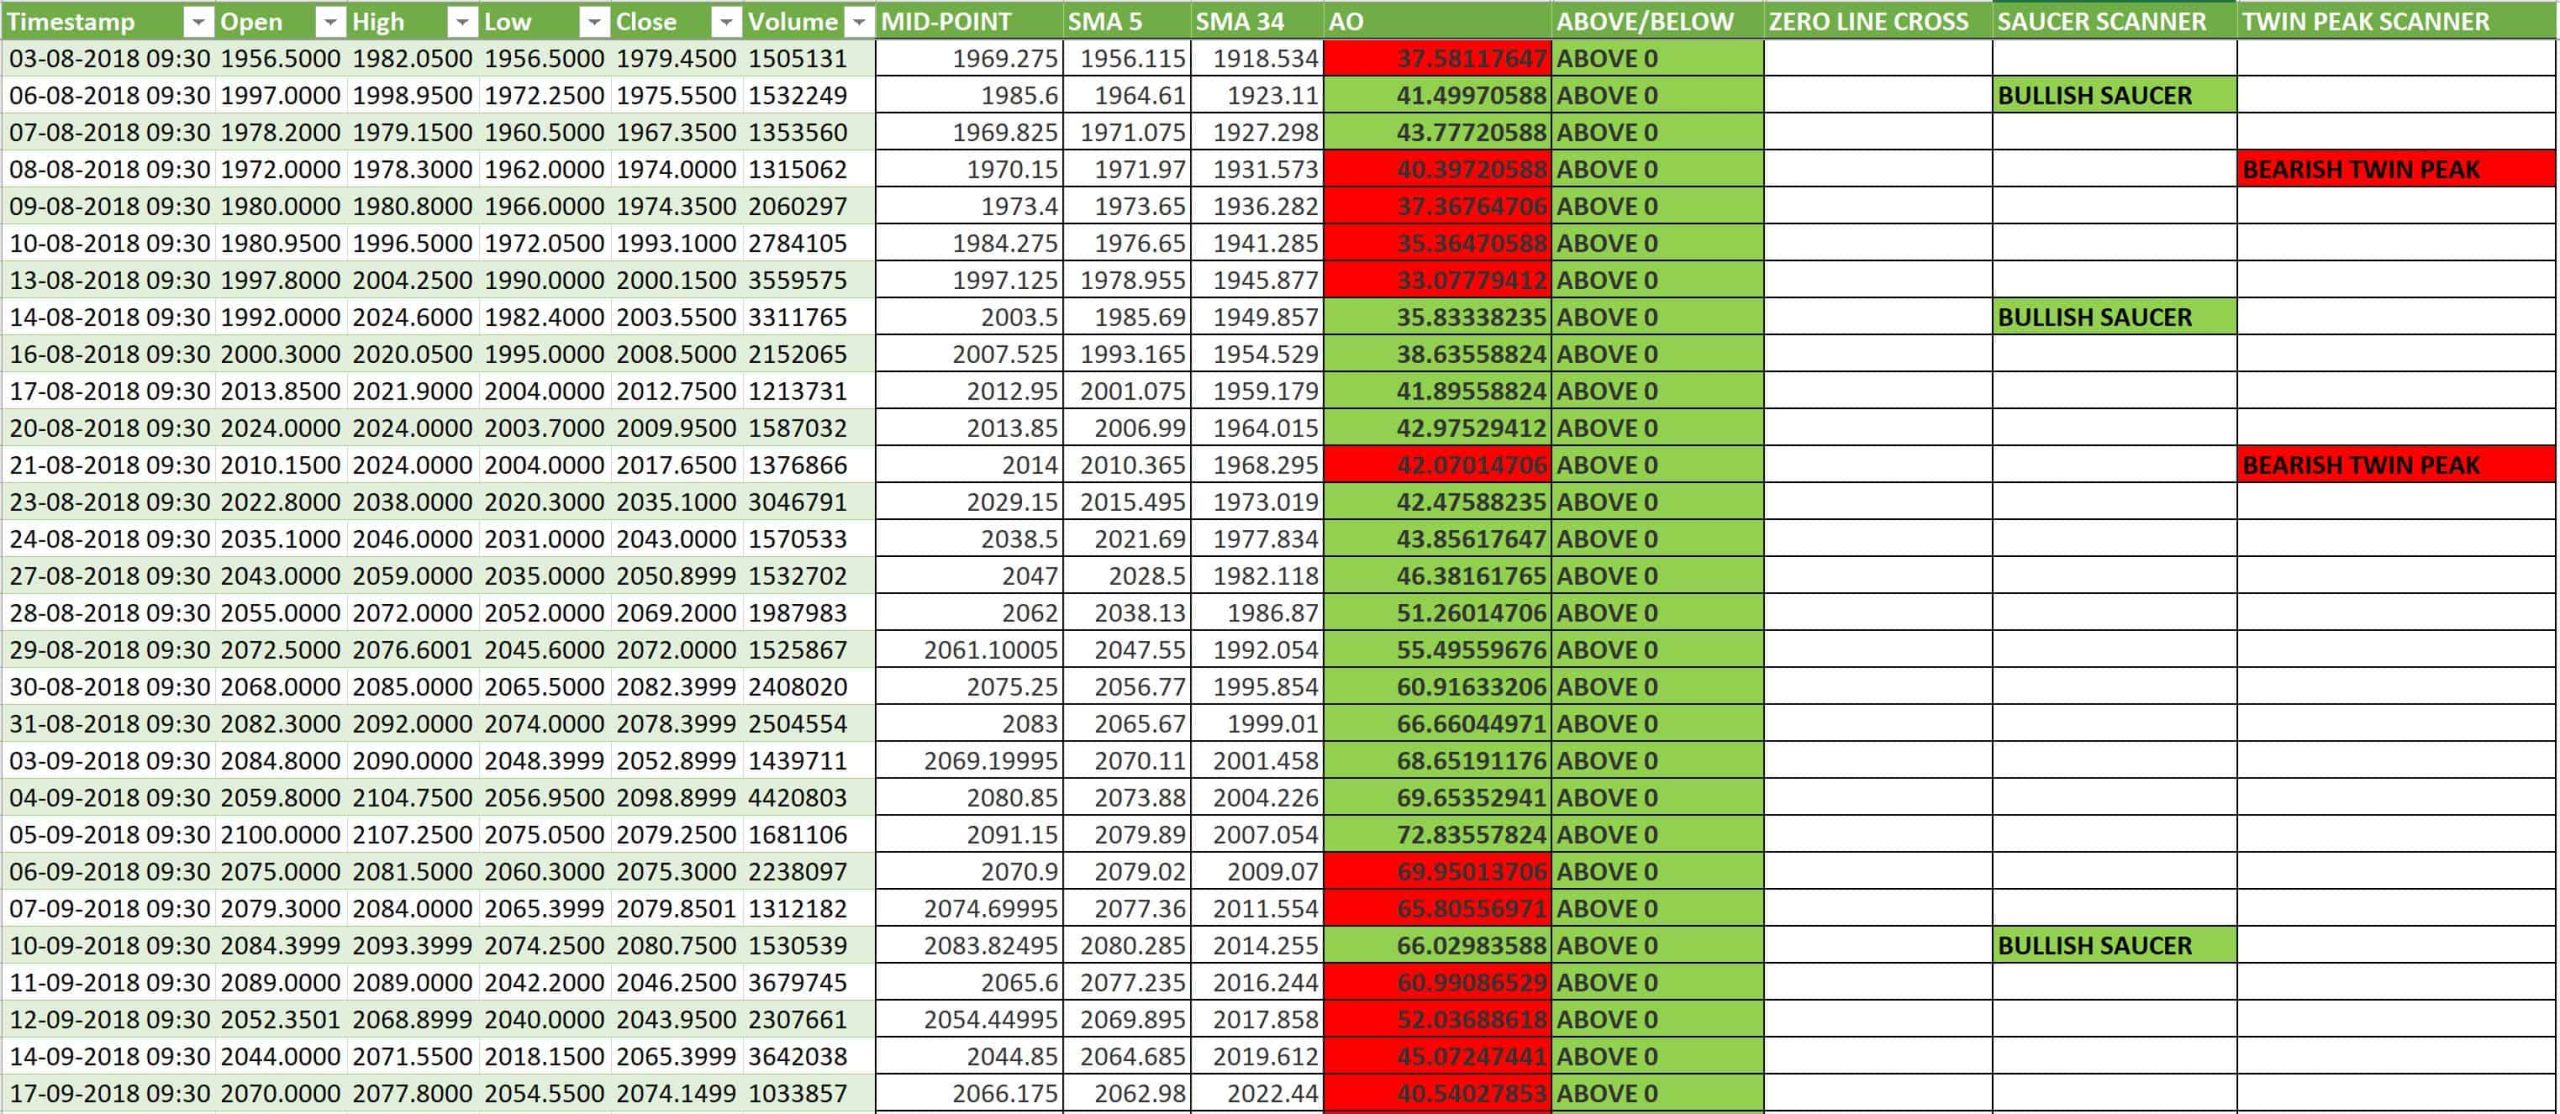
Check out this extraordinary Excel tool that brings the power of the Awesome Oscillator into your hands. It might sound like a bit of hype to call an Excel tool ‘extraordinary,’ but this one is truly deserving of that praise. This isn’t just any spreadsheet; it automatically computes Awesome Oscillator values and identifies possible trading setups as they unfold in real-time. The standout feature is its unique scanning ability, which truly sets it apart as an extraordinary tool. Read on to discover the capabilities of this Excel tool.
Further Reading: Fibonacci Levels: Precision in Trading
What is the Awesome Oscillator?
The Awesome Oscillator is a tool for measuring market momentum, conceived by Bill Williams. It appears as a histogram on charts, comparing short-term momentum to longer-term momentum. It fluctuates above and below a central zero line. To calculate it, you subtract the 34-period simple moving average of the bars’ midpoints from the 5-period average. This calculation results in a histogram colored red and green, where green bars show an increase and red bars indicate a decrease from the previous bar.
Trading with the Awesome Oscillator
There are three popular methods traders use the AO for making trades. Here they are:
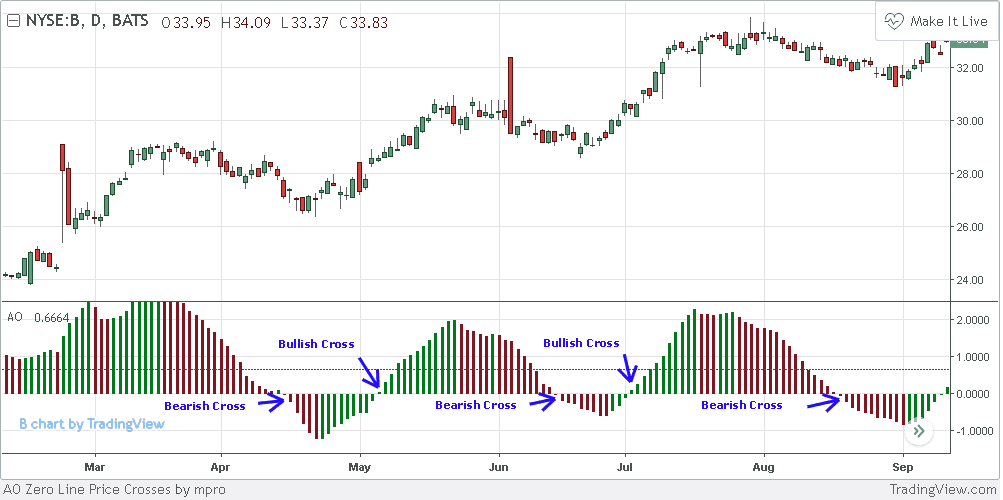
Zero-Line Crossover
- An AO rise above the zero-line suggests a bullish trend and a potential buy signal.
- An AO dip below the zero-line shows a bearish trend, hinting at a sell signal.
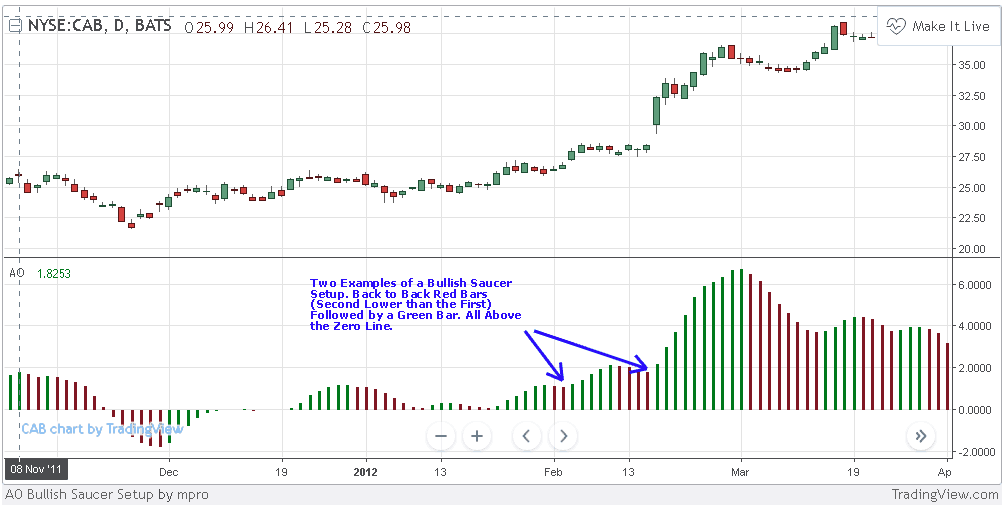
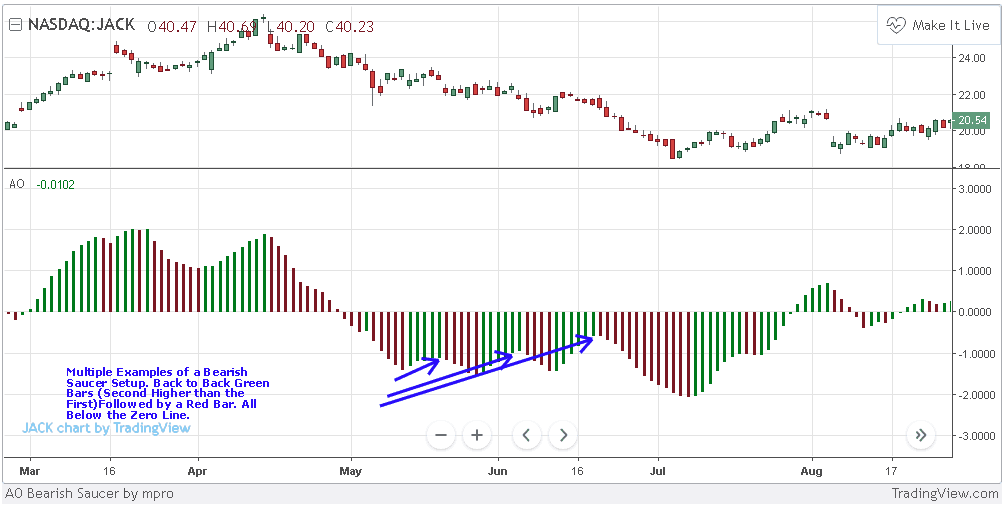
Saucer Setup
A bullish Saucer Setup occurs when there are two consecutive red bars above the zero-line on the AO histogram, followed by a green one, indicating a buy signal. A bearish setup is just the opposite, with two green bars below the zero-line, followed by a red one, signaling a sell opportunity.
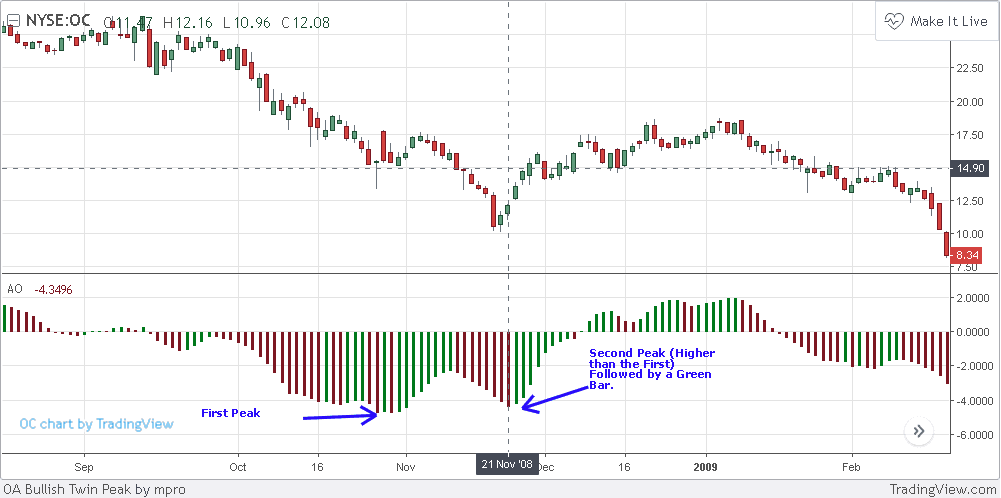
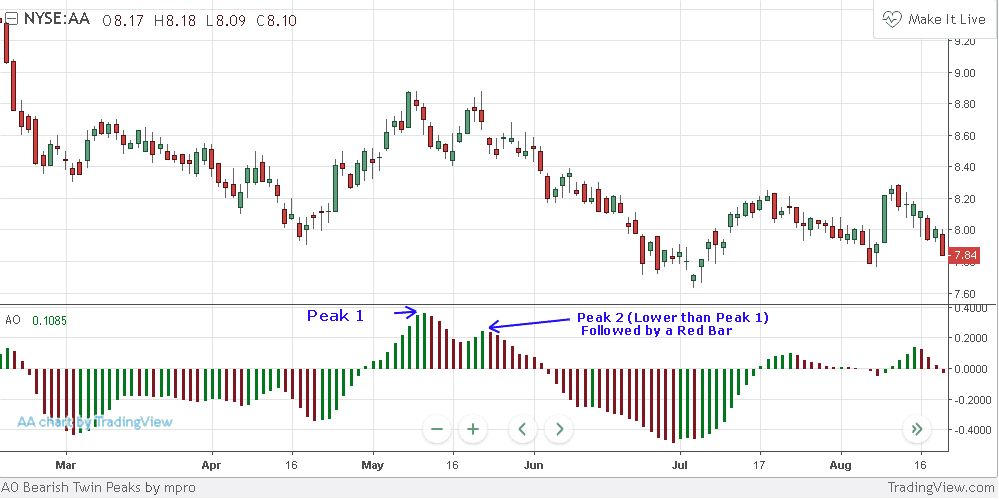
Twin-Peaks Setup
The Bullish Twin-Peaks Setup is a pattern where two lows form below the zero line on the AO histogram, and a green bar that follows signals a buy opportunity. The Bearish Twin-Peaks Setup is similar but occurs above the zero line with two peaks, and a red bar that follows is a sell signal.
Further Reading: Mastering Amibroker: Streamlining Automated Backtesting
Overview of the Excel Sheet with Awesome Oscillator Scanner
Explore our automated Excel sheet that not only calculates Awesome Oscillator values but also actively scans for trading setups in real-time.
Here’s a glimpse of the tool:
How to Use This Excel Sheet?
To get started with this Excel sheet, follow these simple steps:
- Step 1: Download the ‘AWESOME OSCILLATOR SCANNER.xlsm’ file from the download link provided below.
- Step 2: Open the file, and make sure to enable any content if prompted.
- Step 3: Enter the stock symbol and time interval you want to analyze in the ‘parameters’ worksheet.
- Step 4: Set your local timezone offset from EST to accurately reflect your local market times.
- Step 5: Click the ‘Refresh Data’ button to pull the latest data using the AlphaVantage API.
- Step 6: The tool will download the data and automatically calculate AO values. It will also alert you to any potential trade setups.
- Step 7: Regularly refresh the data to monitor market momentum and identify trading opportunities as they arise.
Note: This tool requires Microsoft Excel 2016 or newer. If you have Excel 2010 or 2013, you’ll need to install the latest PowerQuery Add-in.
Download the Excel Sheet
Click the link below to download the Excel tool. If you run into any issues or have questions, please let us know in the comments section:


One Comment