

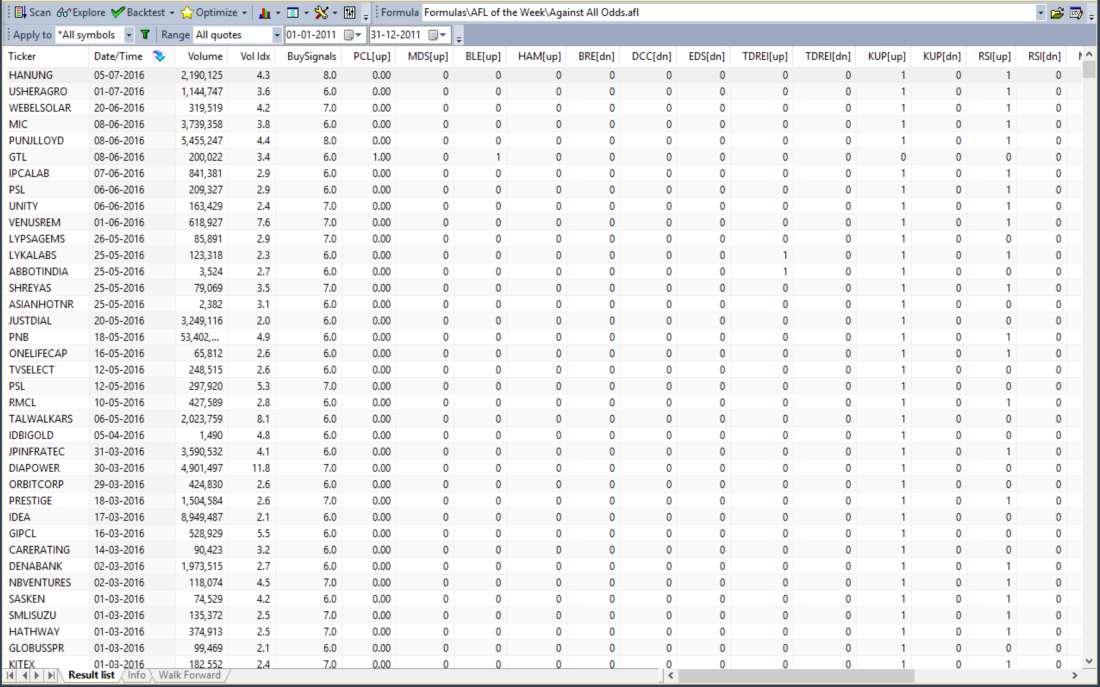
This Amibroker Exploration scans for 24 different buy or sell signals, selecting days when multiple bullish or bearish indicators align. We’ve modified the original exploration AFL to include Buy/Sell signals. With 24 indicators tested simultaneously, this exploration offers high success probability. You can even add your own indicator to the system. The goal is to find days when numerous bullish or bearish signs coincide. For instance, if 5 indicators suggest a buy, it’s more reliable than one. Symbols are sorted by Volume Index, the ratio of the current day’s volume to the 14-day average volume, with the best signals appearing when Volume Index is 2 or greater.
Explore AFL coding and create your trading systems here.
Below is the list of indicators used in this Amibroker Exploration:
PCL[up]: Piercing Line, “up” indicates Bullish.
MDS[up]: Morning Doji Star
BLE[up]: Bullish Engulfing
HAM[up]: Hammer
BRE[dn]: Bearish Engulfing, “dn” denotes Bearish.
DCC[dn]: Dark Cloud Cover
EDS[dn]: Evening Doji Star
TDREI[up] & [dn]: Tom DeMark’s Range Expansion Index
KUP[up] & [dn]: Keltner Bands – DIMITRIS TSOKAKIS
RSI[up] & [dn]: Relative Strength Index 14 periods
MFI[up] & [dn]: Money Flow Index
ST2[up] & [dn]: Stochastic Slow – Donald Dalley
DIV[up] & [dn]: % R divergence – DIMITRIS TSOKAKIS
KST[up] & [dn]: MARTIN PRING’S KST MOMENTUM SYSTEM
COP[up]: Coppock Curve TJ
SMH[up] & [dn]: smash day pattern. DIMA
CHK[up] & [dn]: Chaikin Money Flow. Thierry Huitel
A “1” in the column represents TRUE, while “0” indicates no signal.
Strategy Overview
| Parameter | Value |
| Preferred Timeframe | Daily |
| Indicators Used | 24 indicators as shown above |
| Buy Condition | Buy signal in 6 or more indicators |
| Short Condition | Sell signal in 6 or more indicators |
| Sell Condition | Sell signal in 4 or more indicators |
| Cover Condition | Buy signal in 4 or more indicators |
Amibroker Exploration Code
//------------------------------------------------------
//
// Formula Name: 24-Indicator Amibroker Exploration
// Website: https://zerobrokerageclub.com/
//------------------------------------------------------
_SECTION_BEGIN("Against All Odds");
SetChartOptions(0,chartShowArrows|chartShowDates);
_N(Title = StrFormat("{{NAME}} – {{INTERVAL}} {{DATE}} Open %g, Hi %g, Lo %g, Close %g (%.1f%%) {{VALUES}}", O, H, L, C, SelectedValue( ROC( C, 1 ) ) ));
Plot( Close, "Price", colorWhite, styleCandle );
/* Minimum Price and 14 day Avg Volume Values for Filter */
minPrice = 3; //change as needed
minVol = 50000; //change as needed
VolAvg = ma( v, 14 );
VolumeIdx = v / VolAvg;
AvgRange = sum( abs(O-C),15 )/15;
/* Candle Codes */
White = iif((C>O) AND ((C-O)>=0.8*(H-L)),1,0) AND (C-O)>AvgRange;
Black = iif((C<O) AND ((O-C)>=0.8*(H-L)),1,0) AND (O-C)>AvgRange;
Doji = iif(abs(O-C)<=0.1*(H-L),1,0);
/* Dark Cloud Cover [Bear] */
DCC = iif(ref(White, -1) AND Black AND C<=ref(((H+L)/2),-1)
AND O>ref(C,-1), 1,0);
/* Piercing Line [Bull] */
PL = iif(ref(Black, -1) AND White AND C>=ref(((H+L)/2),-1)
AND O<ref(C,-1), 1,0);
/* Evening Doji Star [Bear] */
EDS = iif(ref(White, -2) AND ref(Doji, -1) AND Black AND
C<=ref(((H+L)/2),-2), 1,0);
/* Morning Doji Star [Bull] */
MDS = iif(ref(Black, -2) AND ref(Doji, -1) AND White AND
C>=ref(((H+L)/2),-2), 1,0);
/* Hammer [Bull] */
HAM = iif( (H-L > 1.5*AvgRange) AND (C > (H+L)/2) AND (O > C) AND
(VolumeIdx > 2), 1, 0);
/* Bearish Engulfing */
BRE = iif(Black AND ref(White, -1) AND (C < ref(O, -1)) AND (O > ref(C, -1)), 1,0);
/* Bullish Engulfing */
BLE = iif(White AND ref(Black, -1) AND (C > ref(O,-1)) AND (O < ref(C,-1)), 1,0);
/* Stochastics 14-4 */
ss = ma(stochk(14),4);
StochBuy = iif(ss<=20, 1, 0);
StochSell = iif(ss>=80, 1, 0);
/* TDREI */
HighMom = H - Ref( H, -2 );
LowMom = L - Ref( L, -2 );
Cond1 = ( H >= Ref( L,-5) OR H >= Ref( L, -6 ) );
Cond2 = ( Ref( H, -2 ) >= Ref( C, -7 ) OR Ref( H, -2 ) >= Ref( C, -8 ) );
Cond3 = ( L <= Ref( H, -5 ) OR L <= Ref( H, -6) );
Cond4 = ( Ref( L, -2 ) <= Ref( C, -7 ) OR Ref( L, -2 ) <= Ref( C, -8 ) );
Cond = ( Cond1 OR Cond2 ) AND ( Cond3 OR Cond4 );
Num = IIf( Cond, HighMom + LowMom, 0 );
Den = Abs( HighMom ) + Abs( LowMom );
TDREI = 100 * Sum( Num, 5 )/Sum( Den, 5 ) ;
tdreiBuy = iif(TDREI<=-95, 1, 0);
tdreiSell = iif(TDREI>=95, 1, 0);
/* KUP */
KUP=EMA((H+L+C)/3,10)+EMA(H-L,10);
KDOWN=EMA((H+L+C)/3,10)-EMA(H-L,10);
kupBuy = iif(CROSS(C,KDOWN), 1, 0);
kupSell = iif(CROSS(KUP,C), 1, 0);
/*RSI*/
vrsi= rsi(14);
rsiBuy = iif(CROSS(vrsi,30), 1, 0);
rsiSell = iif(CROSS(70,vrsi), 1, 0);
/*MFI*/
mfiBuy = iif(CROSS(mfi(),30), 1, 0);
mfiSell = iif(CROSS(70,mfi()), 1, 0);
/*STO2*/
lookback = 14;
buyrange = 30;
sellrange = 70;
stochKworkaround = STOCHk(14);
stochDworkaround = EMA( STOCHd(14), 5);
sto2Buy = iif(STOCHk(14) < buyrange AND CROSS(stochKworkaround, stochDworkaround), 1, 0);
sto2Sell = iif(STOCHk(14) > sellrange AND CROSS(stochDworkaround, stochKworkaround), 1, 0);
/* %R, ema 9 and divergences */
R=-100*((HHV(HIGH,14)-CLOSE))/(HHV(HIGH,14)-LLV(LOW,14));
DIVR=(R-REF(R,-1))*(C-REF(C,-1));
DIVB=IIF((DIVR<0) AND (R-ref(R,-1))>0 and (REF(R,-1)<-90),-100,0);
DIVB1=IIF((DIVR<0) AND (R-ref(R,-1))>0 and (REF(R,-1)<-90),-80,0);
DIVS=IIF((DIVR<0) AND (R-ref(R,-1))<0 and (REF(R,-1)>-10),-20,0);
divBuy = iif(DIVB==-100, 1, 0);
divSell = iif(DIVS==-20, 1, 0);
/*KST*/
KST = (MA(ROC(CLOSE,10),10) * 1) +
(MA(ROC(CLOSE,15),10) * 2) +
(MA(ROC(CLOSE,20),10) * 3) +
(MA(ROC(CLOSE,30),15) * 4);
kstBuy = iif(CROSS(KST , MA(KST, 109)), 1, 0);
kstSell = iif(CROSS(MA(KST , 120), KST), 1, 0);
/*COP*/
copBuy = iif((EMA( ROC( MA( C, 22 ), 250 ), 150 ) / 100) < 0, 1, 0);
/*SMASH*/
numDays = 3; // Consider smash Day if closed above/below previous numDays highs/lows
closeInDayRangePct = 0.25; // Smash day close should be in the high/low %% of the day range
smashDayDown = close < LLV (ref (low, -1), numDays) AND close < open AND close < (low + closeInDayRangePct * (high - low));
smashDayUp = close > HHV (ref (high, -1), numDays) AND close > open AND close > (high - closeInDayRangePct * (high - low));
// Enter in the direction opposite to the smash day if the very next day price moves opposite the smash day.
smashBuy = iif(ref (smashDayDown, -1) AND high > ref (high, -1), 1, 0);
smashSell = iif(ref (smashDayUp, -1) AND low < ref (low, -1), 1, 0);
/*CHAIKIN MONEY FLOW*/
ICH = sum(((( C-L )-( H-C )) / ( H-L ))*V, 21 ) / sum(V,21);
LCH = llv( ICH, 255 );
top = (LCH/2);
chkBuy = cross (ICH, top);
chkSell = cross (0, ICH);
/*number of buy signals --- give weight to your favorite ones with a coefficient. */
BuySignals= PL + MDS + HAM + BLE + tdreiBuy + kupBuy + rsiBuy + (2*mfibuy) + sto2Buy + (2*divBuy) + kstBuy + copBuy + (2*smashBuy) + chkBuy;
/*number of sell signals. */
SellSignals = BRE + DCC + EDS + tdreiSell + kupSell + rsiSell + mfiSell + sto2Sell + divSell + divSell + kstSell + smashSell + chkSell;
/* Exploration Columns for Sorting */
NumColumns = 29;
Column0 = V;
Column1 = VolumeIdx;
Column2 = BuySignals;
Column3 = PL;
Column4 = MDS;
Column5 = BLE;
Column6 = HAM;
Column7 = BRE;
Column8 = DCC;
Column9 = EDS;
Column10 = tdreiBuy;
Column11 = tdreiSell;
Column12 = kupBuy;
Column13 = kupSell;
Column14 = rsiBuy;
Column15 = rsiSell;
Column16 = mfiBuy;
Column17 = mfiSell;
Column18 = sto2Buy;
Column19 = sto2Sell;
Column20 = divBuy;
Column21 = divSell;
Column22 = kstBuy;
Column23 = kstSell;
Column24 = copBuy;
Column25 = smashBuy;
Column26 = smashSell;
Column27 = chkBuy;
Column28 = chkSell;
Column29 = SellSignals;
Column0Name = "Volume";
Column1Name = "Vol Idx";
Column2Name = "BuySignals";
Column3Name = "PCL[up]";
Column4Name = "MDS[up]";
Column5Name = "BLE[up]";
Column6Name = "HAM[up]";
Column7Name = "BRE[dn]";
Column8Name = "DCC[dn]";
Column9Name = "EDS[dn]";
Column10Name = "TDREI[up]";
Column11Name = "TDREI[dn]";
Column12Name = "KUP[up]";
Column13Name = "KUP[dn]";
Column14Name = "RSI[up]";
Column15Name = "RSI[dn]";
Column16Name = "MFI[up]";
Column17Name = "MFI[dn]";
Column18Name = "ST2[up]";
Column19Name = "ST2[dn]";
Column20Name = "DIV[up]";
Column21Name = "DIV[dn]";
Column22Name = "KST[up]";
Column23Name = "KST[dn]";
Column24Name = "COP[up]";
Column25Name = "SMH[up]";
Column26Name = "SMH[dn]";
Column27Name = "CHK[up]";
Column28Name = "CHK[dn]";
Column29Name = "SellSignals";
Column0format = 1.0;
Column1format = 1.1;
Column2format = 1.1;
Column3format = 1.2;
Column4format = 1.0;
Column5format = 1.0;
Column6format = 1.0;
Column7format = 1.0;
Column8format = 1.0;
Column9format = 1.0;
Column10format = 1.0;
Column11format = 1.0;
Column12format = 1.0;
Column13format = 1.0;
Column14format = 1.0;
Column15format = 1.0;
Column16format = 1.0;
Column17format = 1.0;
Column18format = 1.0;
Column19format = 1.0;
Column20format = 1.0;
Column21format = 1.0;
Column22format = 1.0;
Column23format = 1.0;
Column24format = 1.0;
Column25format = 1.0;
Column26format = 1.0;
Column27format = 1.0;
Column28format = 1.0;
Column29format = 1.0;
/* Filter */
/*the highest % for BuySignals gives the most reliable buy signal*/
Filter = (BuySignals>=6 OR SellSignals>=6) and VolumeIdx>=2;
/*Filter = ((C > minPrice) AND (VolAvg >= minVol)) AND (StochBuy AND (PL or MDS or BLE or HAM)) OR (StochSell AND (BRE or DCC or EDS));*/
/* Buy and Sell */
/* set your own requirements: how many indicators triggered at the same time */
Buy = BuySignals>=6;
Short = SellSignals>=6;
Sell = SellSignals>=4;
Cover = BuySignals>=4;
Buy = ExRem(Buy,Sell);
Sell = ExRem(Sell,Buy);
Short=ExRem(Short,Cover);
Cover=ExRem(Cover,Short);
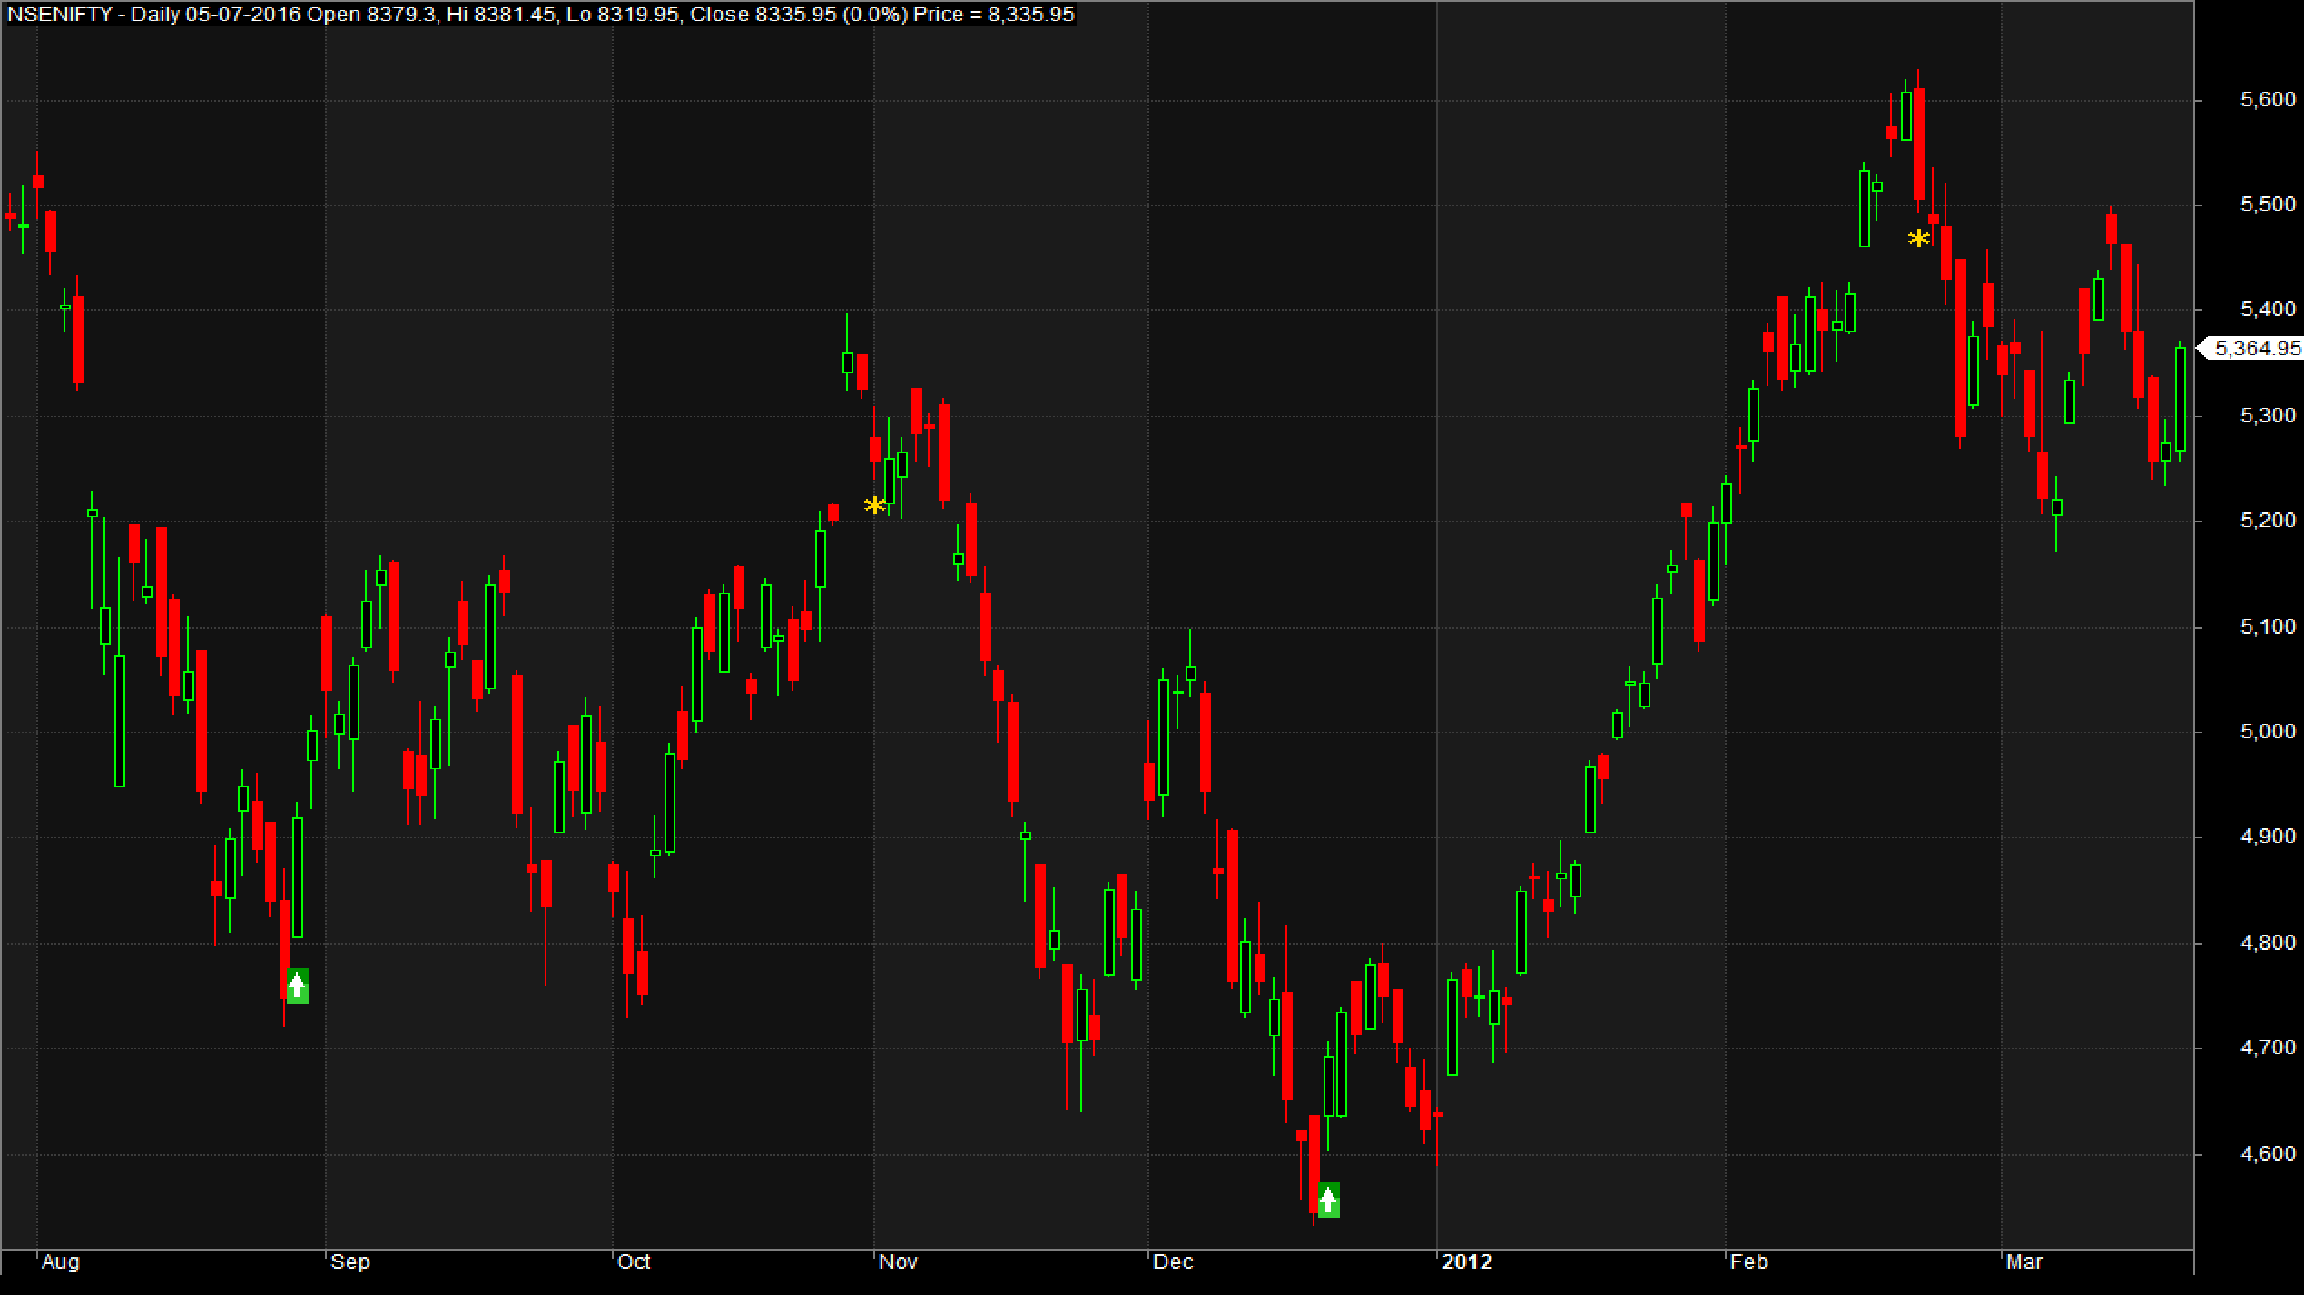
/* Plot Buy and Sell Signal Arrows */
PlotShapes(IIf(Buy, shapeSquare, shapeNone),colorGreen, 0, L, Offset=-25);
PlotShapes(IIf(Buy, shapeSquare, shapeNone),colorLime, 0,L, Offset=-35);
PlotShapes(IIf(Buy, shapeUpArrow, shapeNone),colorWhite, 0,L, Offset=-30);
PlotShapes(IIf(Short, shapeSquare, shapeNone),colorRed, 0, H, Offset=25);
PlotShapes(IIf(Short, shapeSquare, shapeNone),colorOrange, 0,H, Offset=35);
PlotShapes(IIf(Short, shapeDownArrow, shapeNone),colorWhite, 0,H, Offset=-30);
PlotShapes(IIf(Sell, shapeStar, shapeNone),colorGold, 0, L, Offset=-15);
PlotShapes(IIf(Cover, shapeStar, shapeNone),colorGold, 0,L, Offset=-15);
_SECTION_END();
Ask AI to edit or generate...


One Comment