

Understanding Pivot Points: A Key Tool in Technical Analysis
Pivot points are crucial yet simple indicators in Technical Analysis. They consist of a pivot line encircled by support and resistance levels, aiding in forecasting price movements. Among its various forms, the Central Pivot Range or CPR Indicator stands out for its effectiveness.
This piece offers an insightful exploration of the CPR, including its foundation, computation, application, and real-world examples. Let’s begin this journey.
Central Pivot Range (CPR) Explained
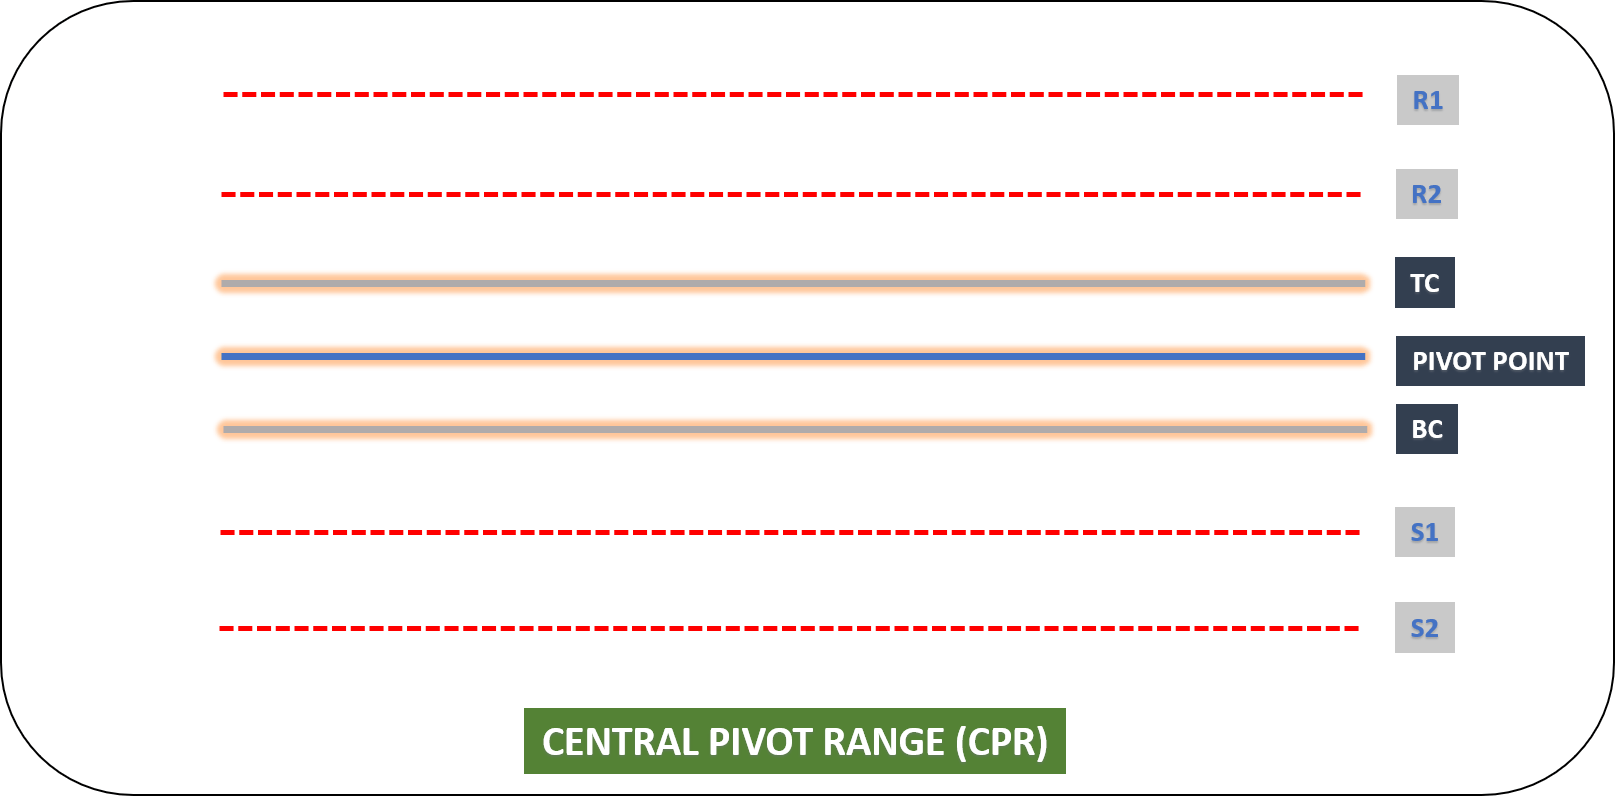
The Central Pivot Range (CPR) is a multifaceted technical indicator composed of three elements – a central pivot point, a top central level (TC), and a bottom central level (BC).
Calculating these levels is straightforward:
- TC = (Pivot – BC) + Pivot
- Pivot = (High + Low + Close) / 3
- BC = (High + Low) / 2
The formula for CPR uses three basic variables: High, Low, and Close prices. On a stock chart, TC generally appears highest, pivot in the middle, and BC the lowest. However, TC can occasionally be lower than BC depending on the market. The highest and lowest of these values are labeled as TC and BC, respectively.
At its core, CPR posits that a day’s trading range is a mirror of market sentiment, serving as a predictor for the next day’s price movements.
These CPR levels are determined using the previous day’s high, low, and close prices and are fixed for the entire day.
The CPR indicator was initially introduced by Mark Fisher in his book “The Logical Trader,” and later expanded by Frank Ochoa with the addition of the central pivot point.
Frank Ochoa describes it as:
“CPR: The Swiss Army Knife of pivots, guiding the market tides like the Moon.”
CPR vs Traditional Pivot Points
Contrasting with traditional pivot points that feature a central line with adjacent support and resistance levels,
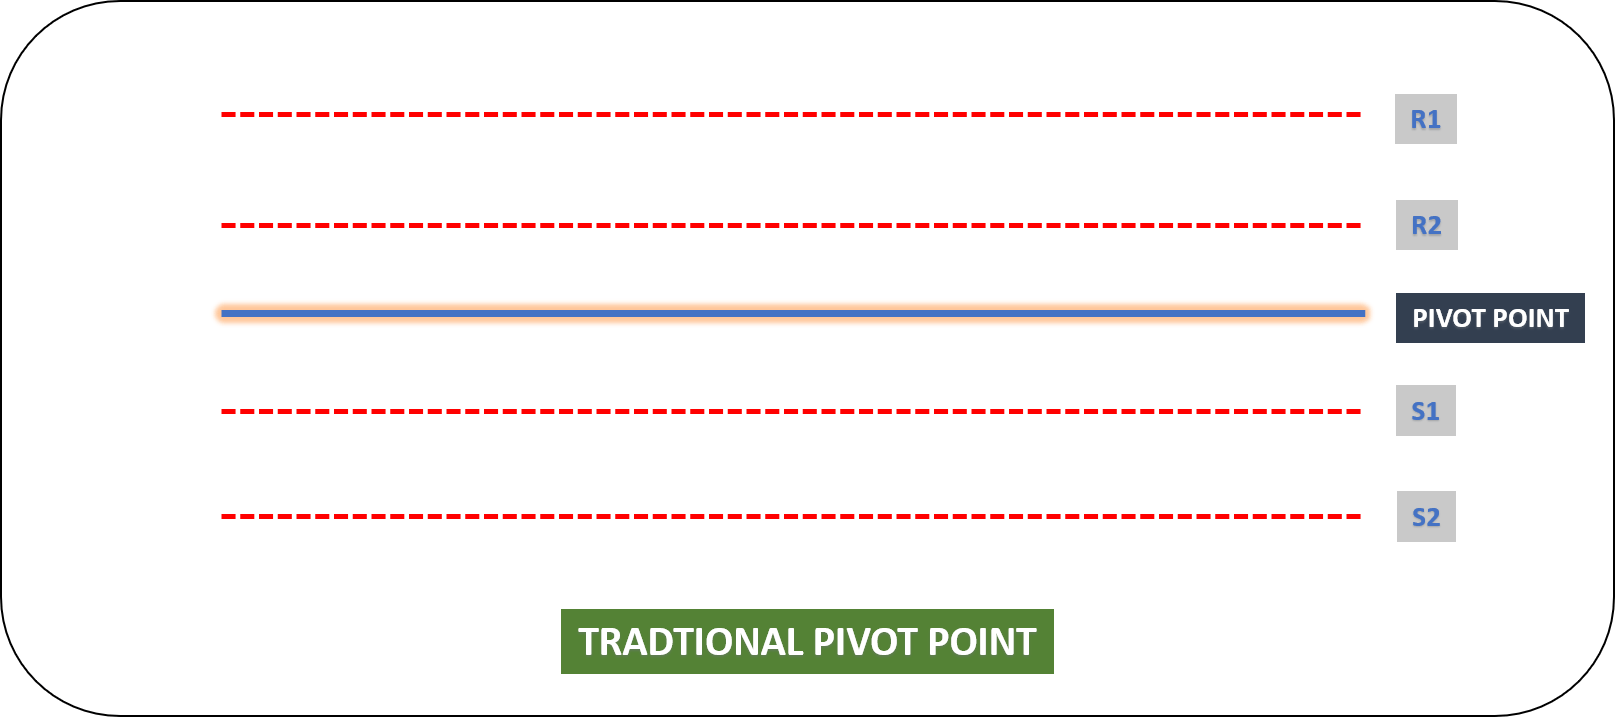 CPR distinguishes itself with its three-tier structure: a central pivot point, a top central level (TC), and a bottom central level (BC), surrounded by the customary support and resistance lines.
 Also Read: Camarilla Pivot Points Excel Sheet: Live Signals
Understanding Virgin CPR
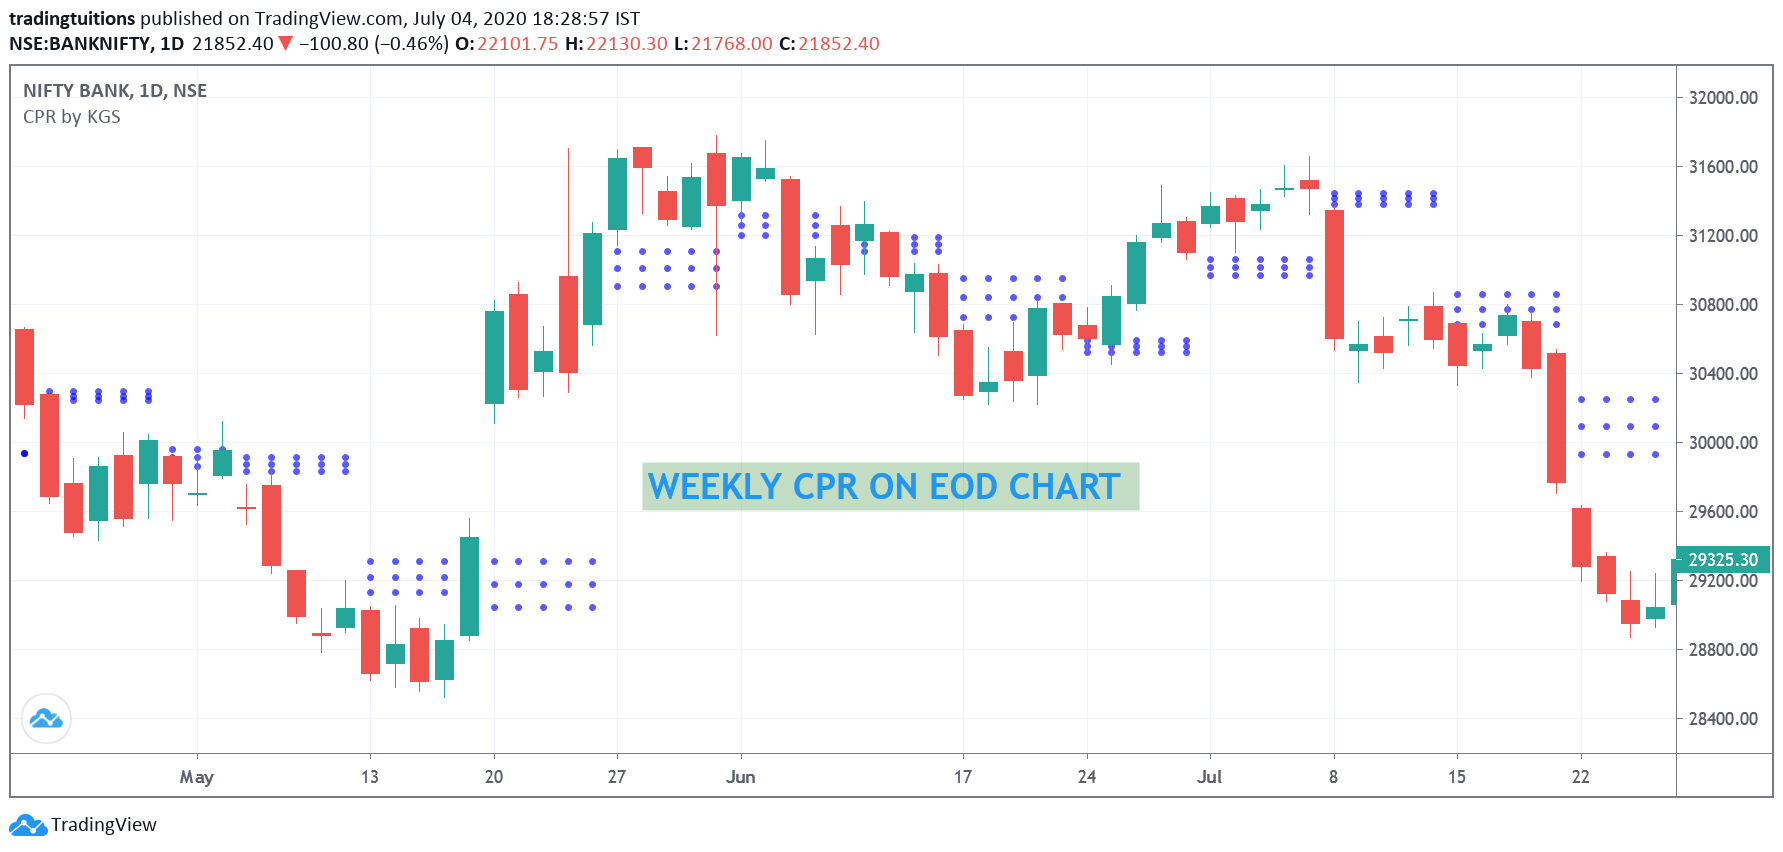
When a specific timeframe’s price levels don’t intersect the CPR levels of that same timeframe, this scenario is termed as Virgin CPR.
Observe the chart below where blue dotted lines represent CPR levels, and notice how none of the price bars intersect these levels.
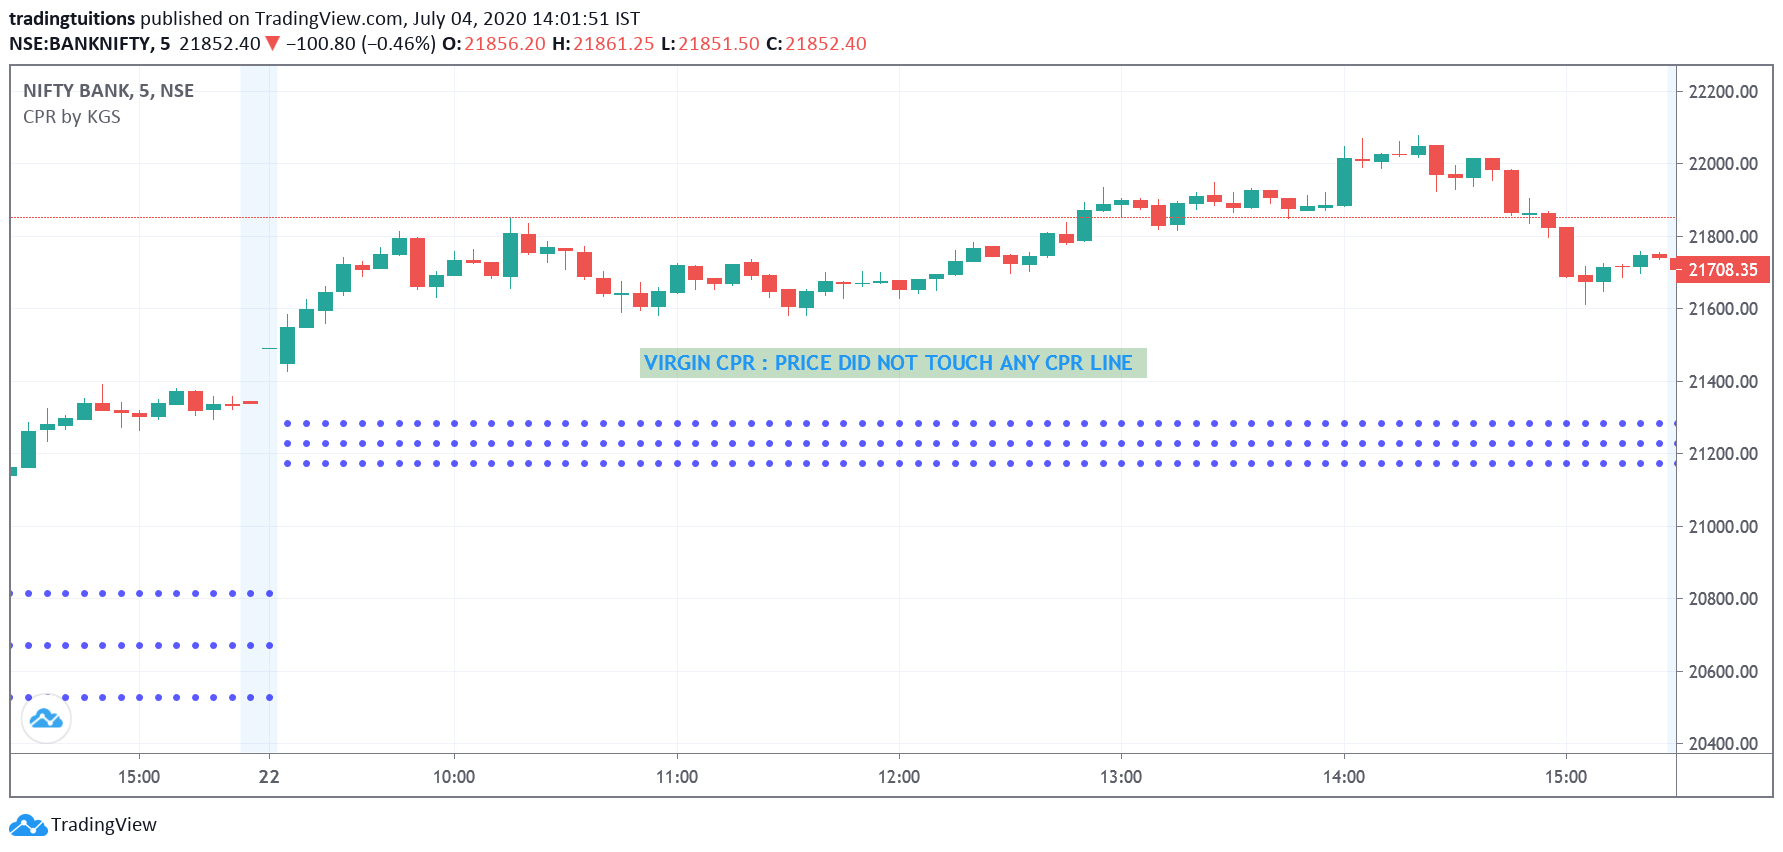
Statistics suggest a 30-40% chance that prices won’t reach the CPR levels on any given day.
Virgin CPR is considered a robust support or resistance level, which we’ll explore further in this article.
Strategies for Trading with CPR
There are numerous tactics for incorporating the CPR indicator into trading decisions. Here are the key strategies:
-
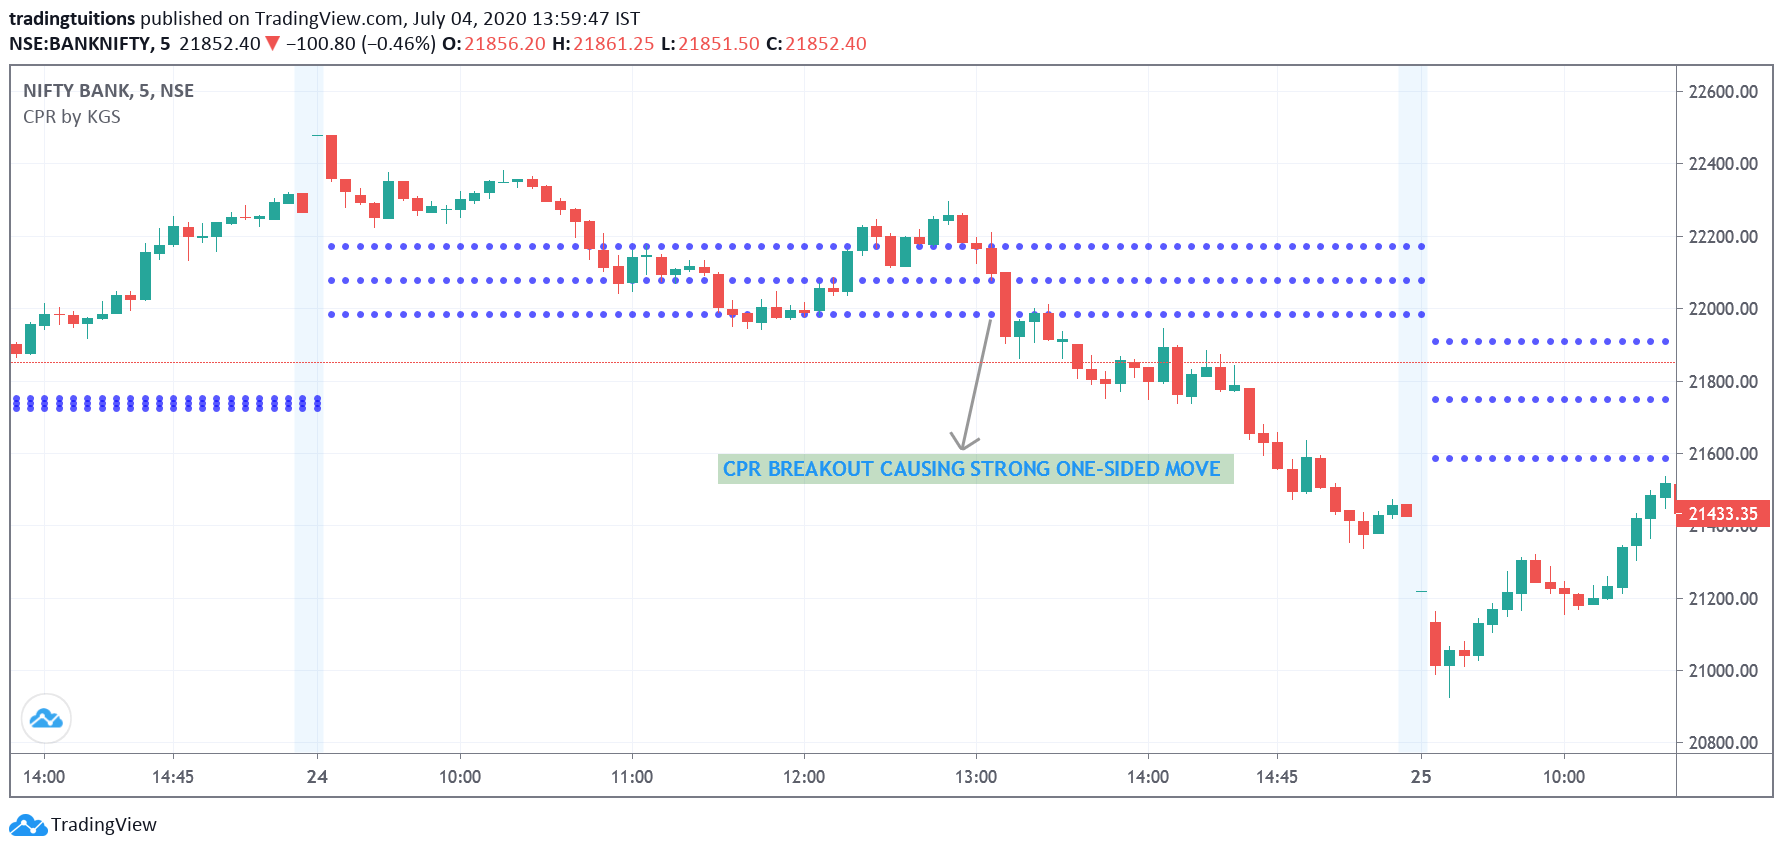
CPR Breakout
A breakout above the TC or below the BC indicates a strong likelihood of continuing movement. A breakout candle with higher volume than its predecessors adds further confirmation.
-
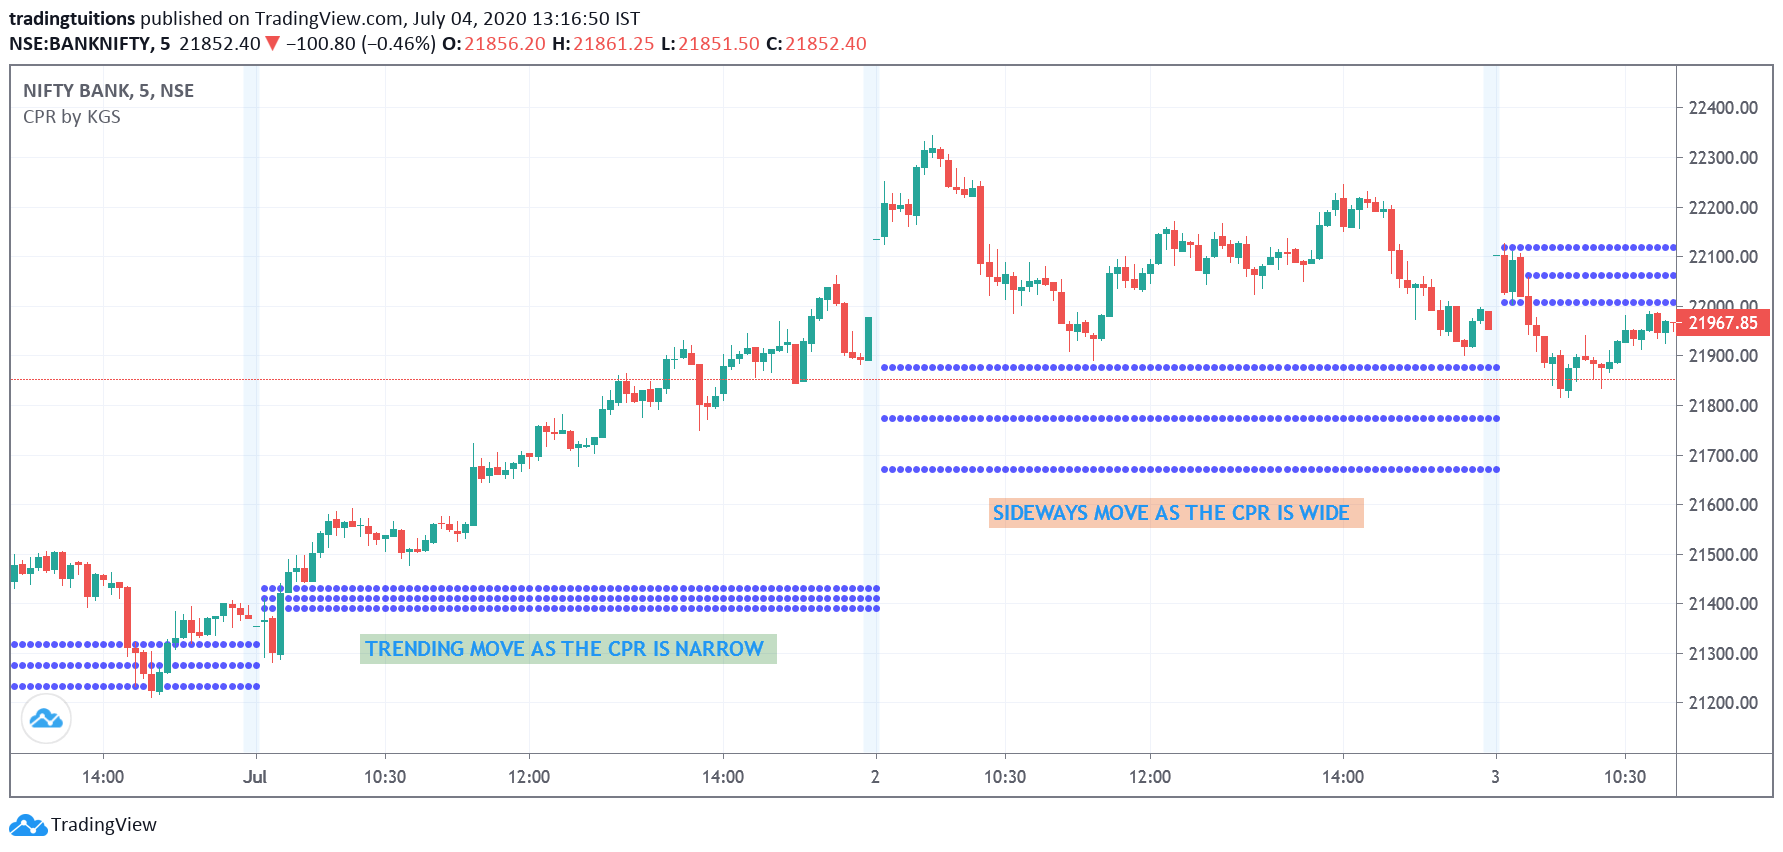
CPR Width
The distance between the TC and BC lines provides insights into expected market trends. A narrower CPR width suggests a trending market, while a wider distance hints at a sideways market.
-
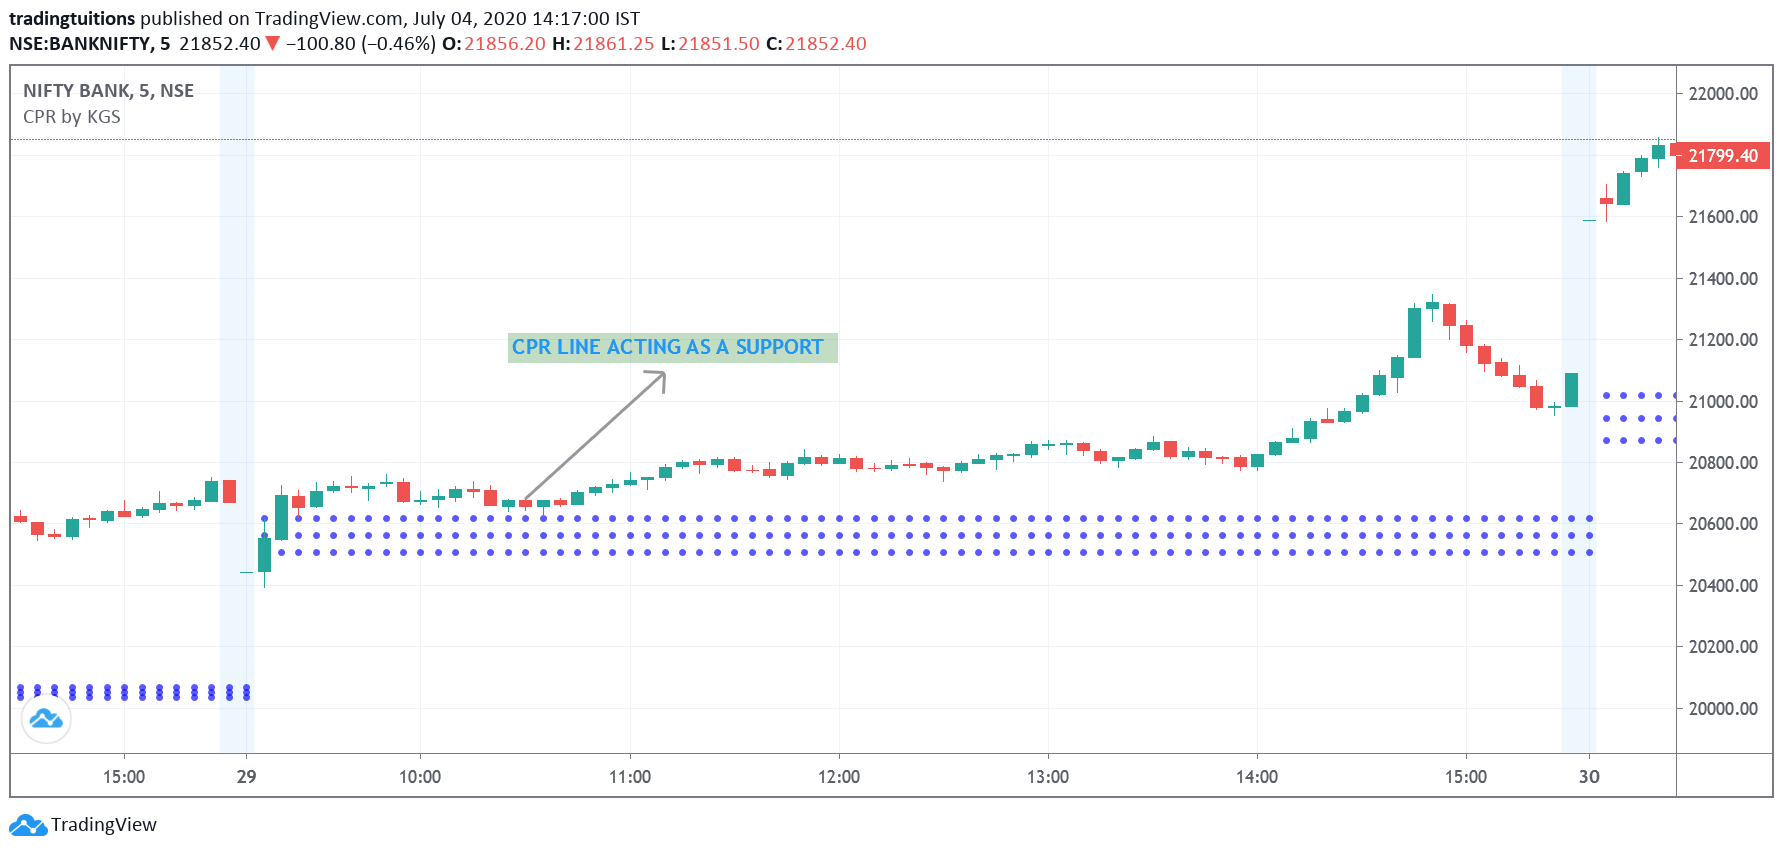
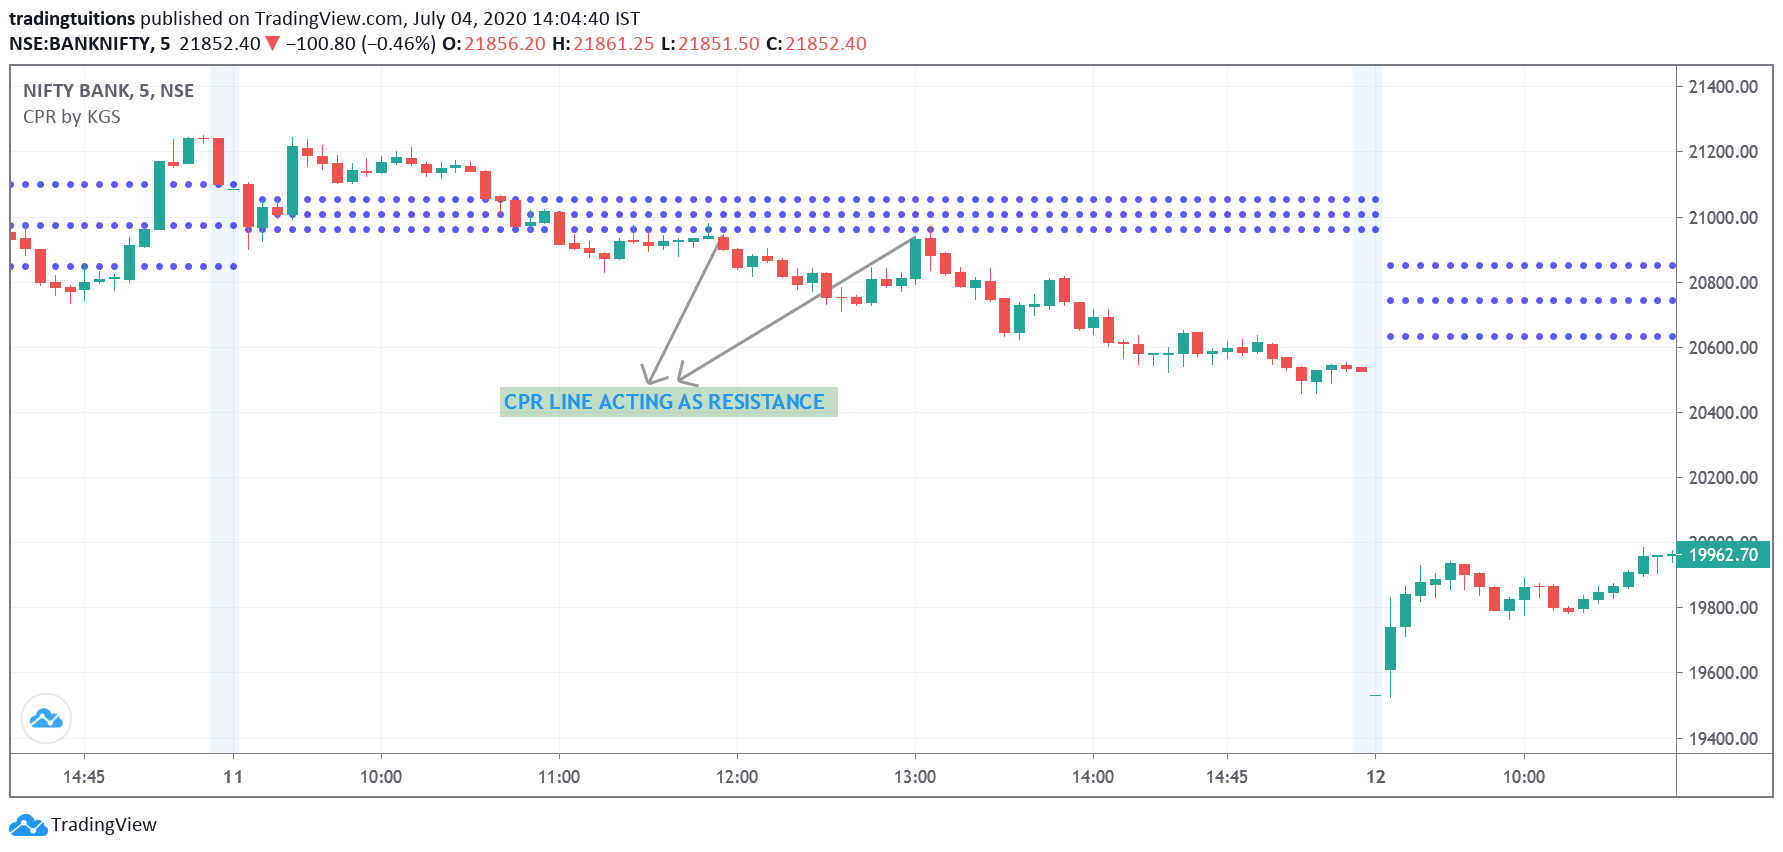
CPR as Support and Resistance
CPR lines can serve as critical support and resistance levels, aiding in setting stop loss levels. Any of the three CPR lines can be used for this purpose.
-
Interpreting Trends with CPR
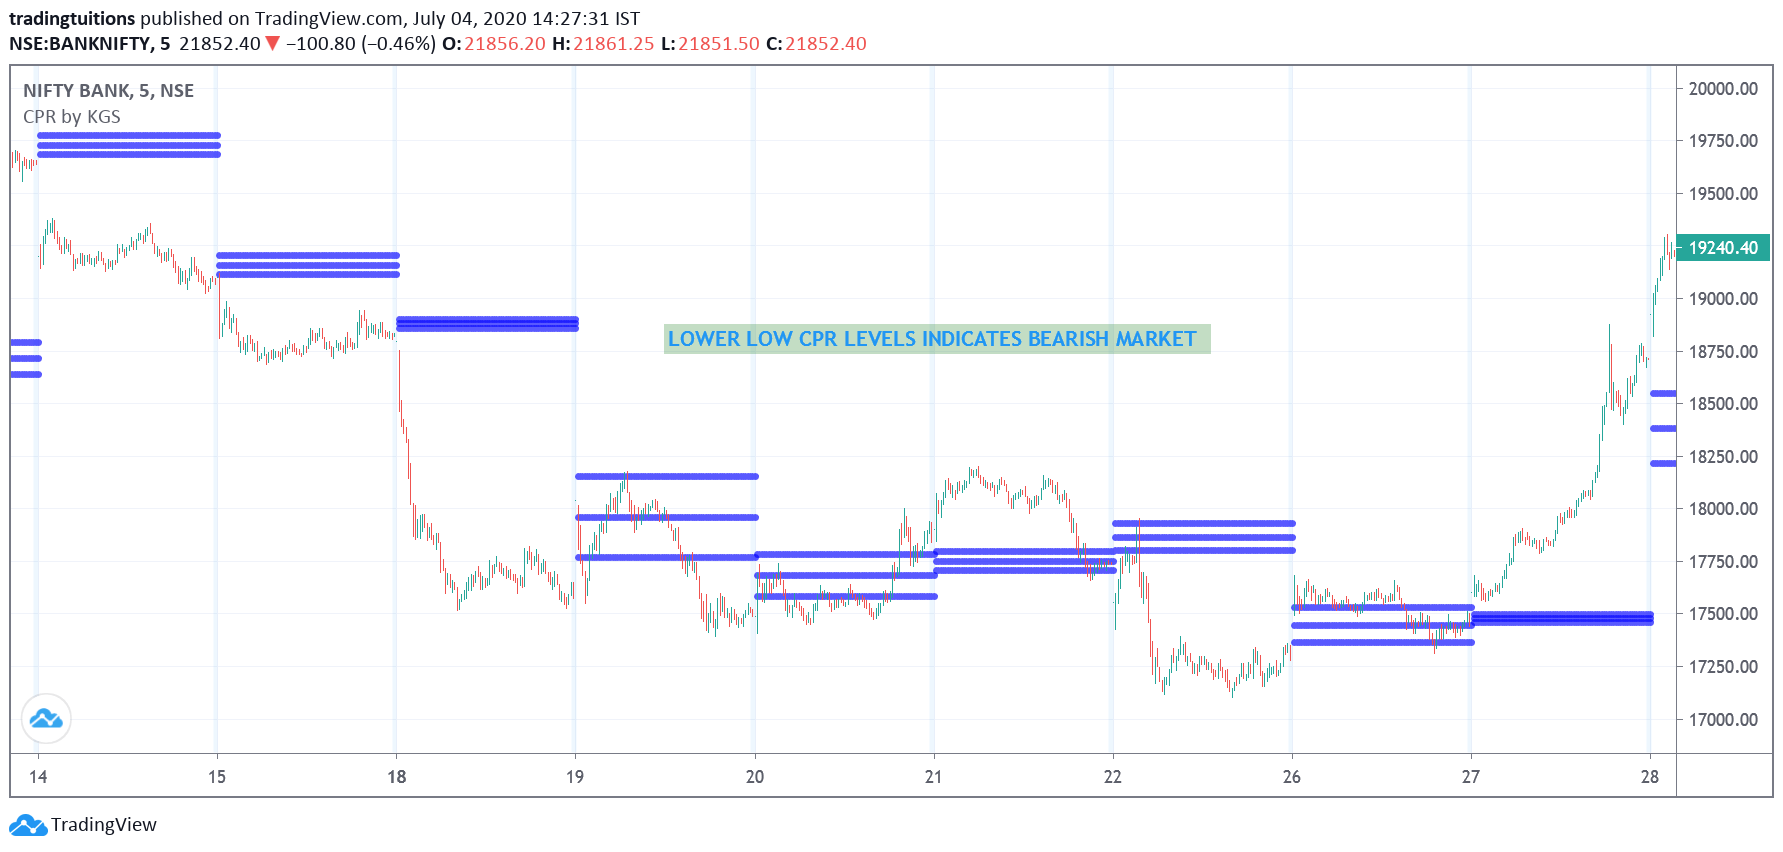
Understanding the overall market trend via CPR involves observing the pattern of its lines. An upward ‘ladder’ formation of CPR lines suggests strong bullish sentiment.
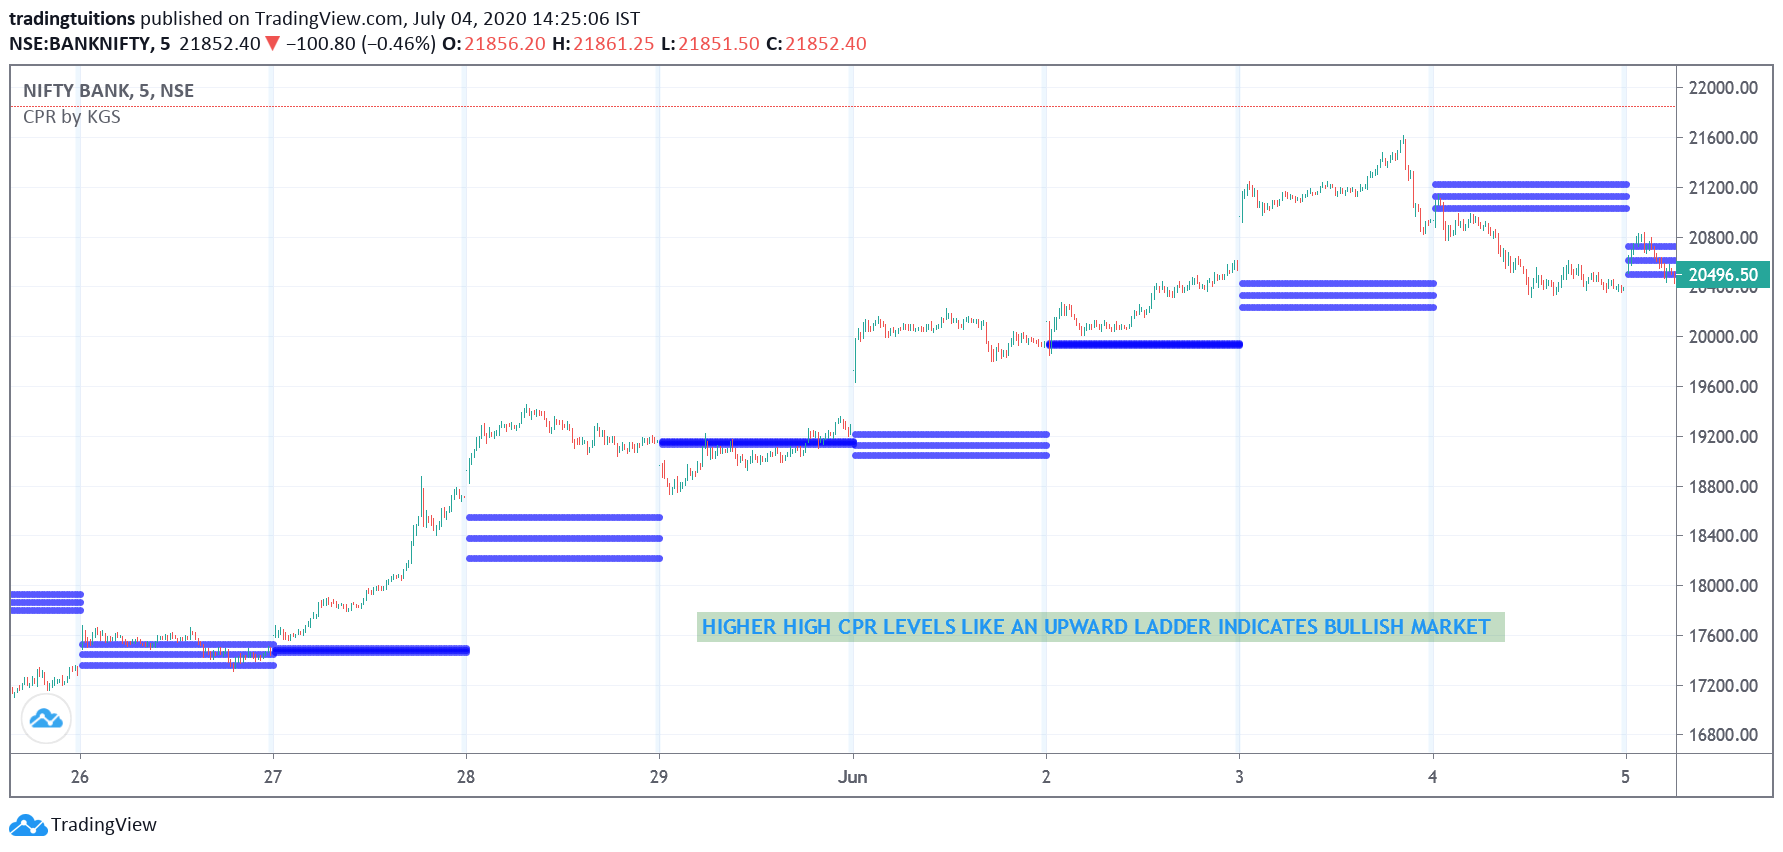
Conversely, a downward ‘ladder’ pattern in CPR lines typically signals bearish market conditions.
-
Trading with Virgin CPR Indicator
Virgin CPR levels from the previous day act as strong support or resistance. When prices touch these levels, a sharp reversal is often observed.
Also Read: Range Breakout Amibroker Exploration with Buy Sell Signals
Optimal Timeframes for CPR Usage
CPR levels are generally calculated daily and are most effective for intraday trading. The examples shown here follow this approach.
However, CPR can be equally effective in longer timeframes. For end-of-day trading, weekly price levels should be used to calculate CPR. This principle can be applied to any timeframe.
Accessing CPR Indicator on TradingView Charts
Several versions of the CPR indicator are available on TradingView. A recommended one is Pivot Points CPR with M, W, D High Low by GomathiShankar.
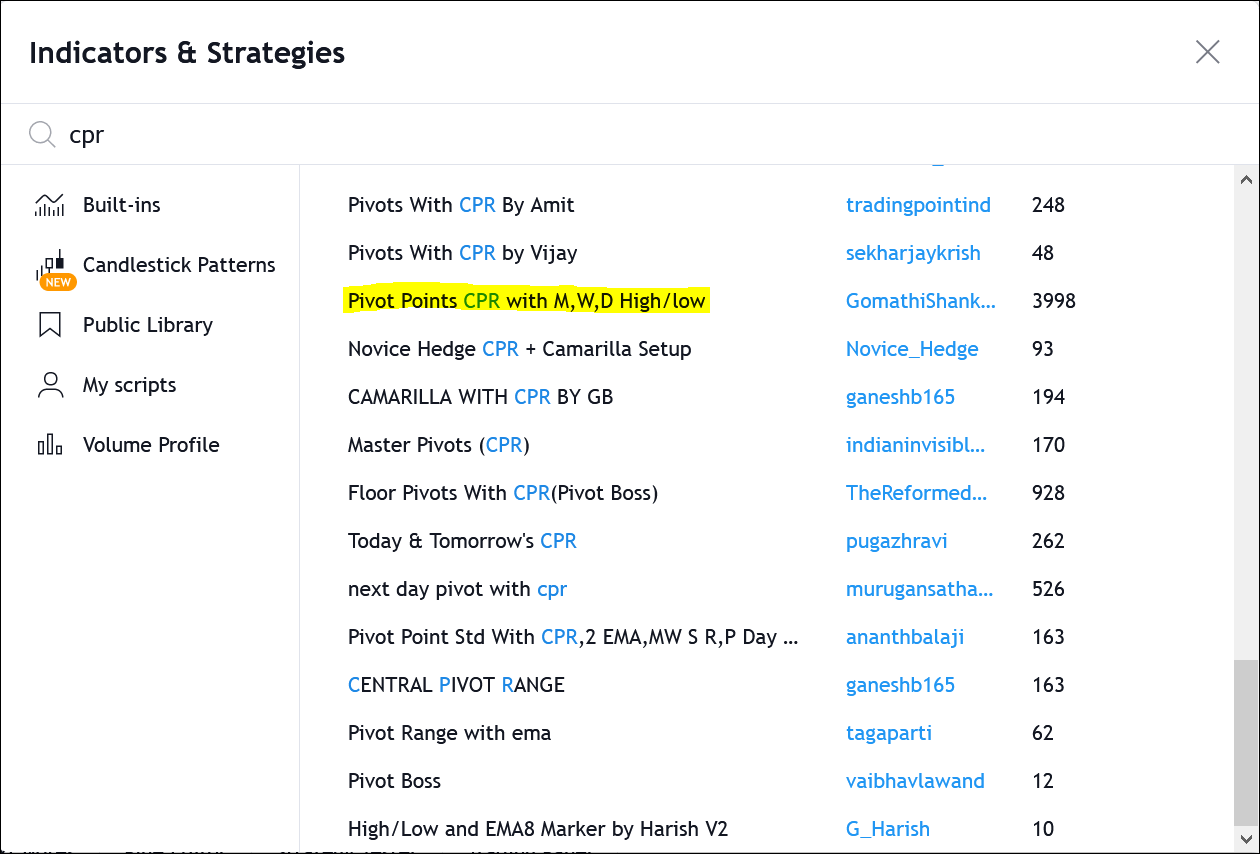 Note that this is not a built-in indicator but is available in the public library at no cost.
Evaluating CPR Indicator’s Accuracy for Intraday Trading
Our analysis reveals the CPR indicator’s high accuracy in intraday trading, particularly when applied to a 5-minute chart for volatile stocks or indices.
Trading based on CPR breakout with volume confirmation has a success rate of up to 70%. However, always include a stop loss to protect against unforeseen market movements. For instance, if you’re buying based on a TC breakout, the BC line can serve as a stop loss. In cases of narrow CPR width, consider using the previous day’s CPR levels as a stop loss.
While CPR is highly effective, remember that success also hinges on proper position sizing and risk management.
Automate Your CPR Analysis with a Spreadsheet
Access a fully automated CPR spreadsheet through the following link:
CPR Spreadsheet with Narrow Range Indicator
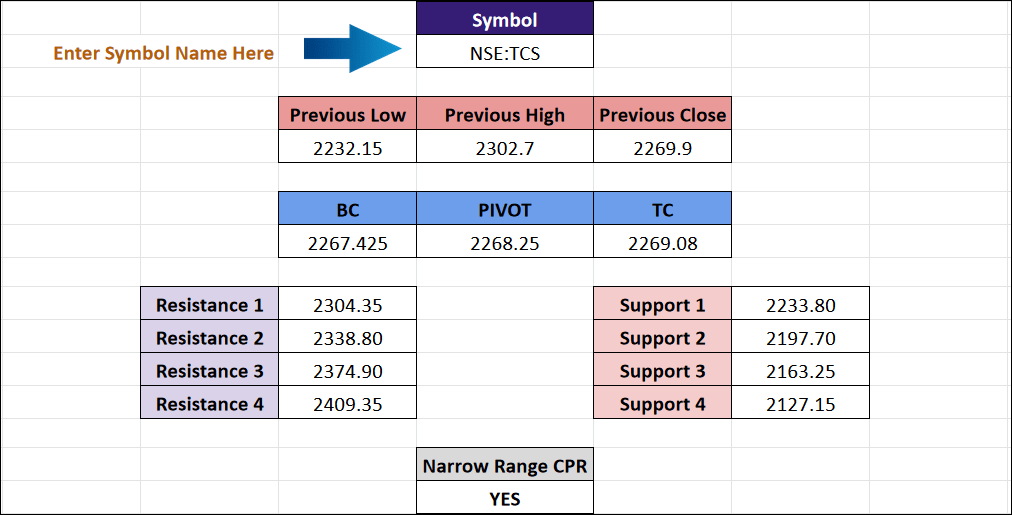 This tool allows you to calculate CPR and support/resistance levels for any symbol.
Download the CPR AFL Code for Amibroker
Get the Amibroker AFL code for CPR from this link:
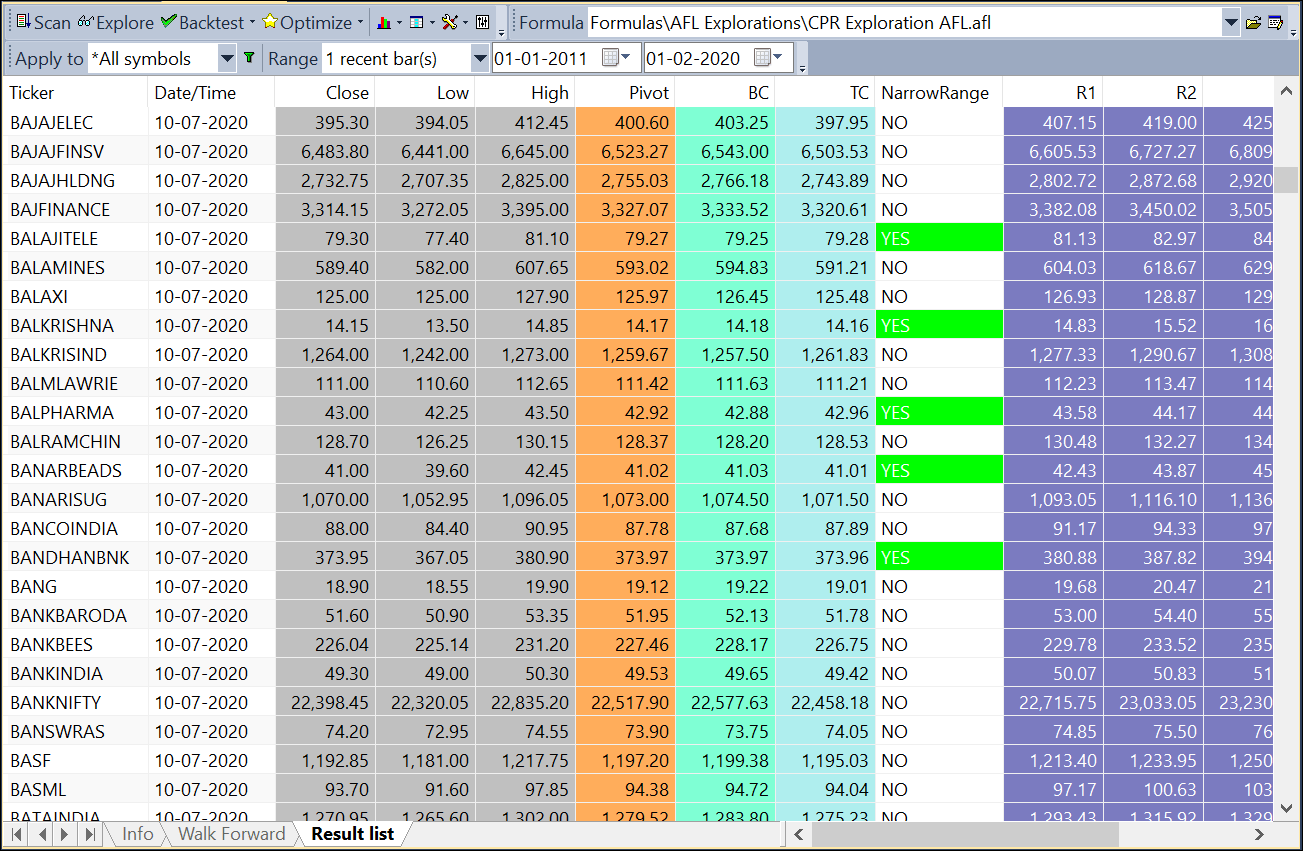 With this code, view CPR levels for all stocks in your watchlist and scan for narrow range stocks.


3 Comments