Welcome to AFL of the Week
Discover profitable AFLs for Amibroker without the hassle of coding or falling for scams. We provide ready-to-use AFL code and backtest reports, saving you time and money. In this article, we are going to discuss EMA crossover.
Read Also: A Trading System Utilizing Support and Resistance in AFL
Strategy Overview
| Parameter | Value |
| Preferred Timeframe | Daily |
| Indicators Used | 14-period EMA, 73-period EMA |
| Buy Condition | 14-period EMA crosses above 73-period EMA (Buy at the next day’s Open) |
| Sell Condition | 14-period EMA crosses below 73-period EMA (Sell at the next day’s Open) |
| Stop Loss | No fixed stop loss; Stop and reverse when AFL gives an opposite signal |
| Targets | No fixed target; Stop and reverse when AFL gives an opposite signal |
| Position Size | 150 (fixed) |
| Initial Equity | 200,000 |
| Brokerage | 50 per order |
| Margin | 10% |
AFL Code for EMA Crossover
//------------------------------------------------------
//
// Formula Name: 14-73 Crossover Trading System
// Website: zerobrokerageclub.com
//------------------------------------------------------
_SECTION_BEGIN("14-73 Crossover Trading System");
SetChartOptions(0,chartShowArrows|chartShowDates);
_N(Title = StrFormat("{{NAME}} – {{INTERVAL}} {{DATE}} Open %g, Hi %g, Lo %g, Close %g (%.1f%%) {{VALUES}}", O, H, L, C, SelectedValue( ROC( C, 1 ) ) ));
//Initial Parameters
SetTradeDelays( 1, 1, 1, 1 );
SetOption( "InitialEquity", 200000);
SetOption("FuturesMode" ,True);
SetOption("MinShares",1);
SetOption("CommissionMode",2);
SetOption("CommissionAmount",50);
SetOption("AccountMargin",10);
SetOption("RefreshWhenCompleted",True);
SetPositionSize(150,spsShares);
SetOption( "AllowPositionShrinking", True );
BuyPrice=Open;
SellPrice=Open;
ShortPrice=Open;
CoverPrice=Open;
//Parameters
MALength1 = 14;
MALength2 = 73;
//Buy-Sell Logic
Buy = Cross(ema( C, MALength1 ),ema( C, MALength2 ));
Sell =Cross( ema( C, MALength2 ), ema( C, MALength1 )) ;
Buy = ExRem( Buy, Sell );
Sell = ExRem( Sell, Buy );
Short = Sell;
Cover = Buy;
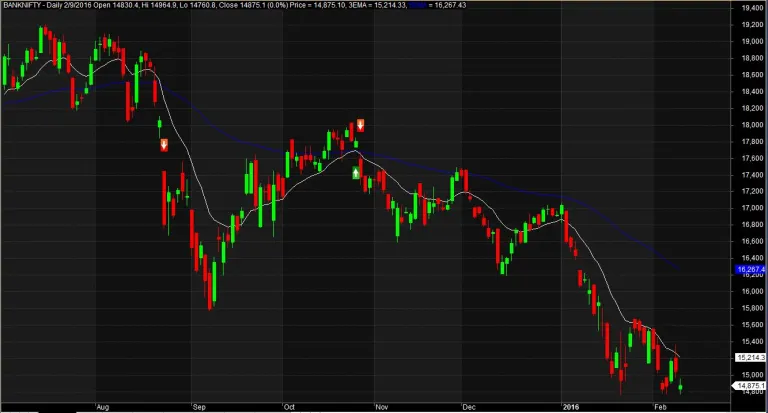
Plot( Close, "Price", colorWhite, styleCandle );
Plot(ema( C, MALength1 ),"FastEMA",colorWhite);
Plot(ema( C, MALength2 ),"SlowEMA",colorBlue);
/* Plot Buy and Sell Signal Arrows */
PlotShapes(IIf(Buy, shapeSquare, shapeNone),colorGreen, 0, L, Offset=-40);
PlotShapes(IIf(Buy, shapeSquare, shapeNone),colorLime, 0,L, Offset=-50);
PlotShapes(IIf(Buy, shapeUpArrow, shapeNone),colorWhite, 0,L, Offset=-45);
PlotShapes(IIf(Cover, shapeSquare, shapeNone),colorGreen, 0, L, Offset=-40);
PlotShapes(IIf(Cover, shapeSquare, shapeNone),colorLime, 0,L, Offset=-50);
PlotShapes(IIf(Cover, shapeUpArrow, shapeNone),colorWhite, 0,L, Offset=-45);
PlotShapes(IIf(Sell, shapeSquare, shapeNone),colorRed, 0, H, Offset=40);
PlotShapes(IIf(Sell, shapeSquare, shapeNone),colorOrange, 0,H, Offset=50);
PlotShapes(IIf(Sell, shapeDownArrow, shapeNone),colorWhite, 0,H, Offset=-45);
PlotShapes(IIf(Short, shapeSquare, shapeNone),colorRed, 0, H, Offset=40);
PlotShapes(IIf(Short, shapeSquare, shapeNone),colorOrange, 0,H, Offset=50);
PlotShapes(IIf(Short, shapeDownArrow, shapeNone),colorWhite, 0,H, Offset=-45);
_SECTION_END();
Backtest Report
| Parameter | Value | |
|---|---|---|
| Nifty | Bank Nifty | |
| Initial Capital | 200,000 | 200,000 |
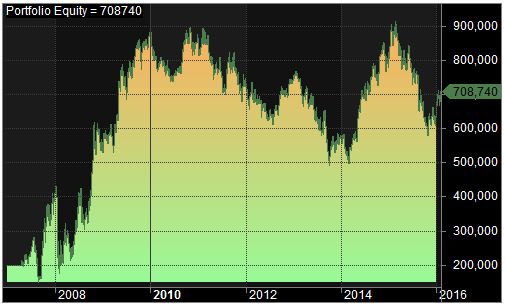
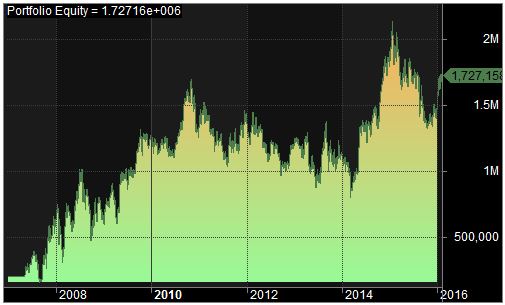
| Final Capital | 708,740 | 1,727,157.50 |
| Backtest Period | 02-Jan-2007 to 09-02-2016 | 02-Jan-2007 to 09-02-2016 |
| Net Profit % | 254.37% | 763.58% |
| Annual Return % | 14.90% | 26.70% |
| Number of Trades | 36 | 36 |
| Winning Trade % | 22.22% | 38.89% |
| Average Holding Period | 61.28 periods | 60.92 periods |
| Max Consecutive Losses | 9 | 4 |
| Max System % Drawdown | -59.29% | -59.40% |
| Max Trade % Drawdown | -22.08% | -97.77% |
Download the detailed backtest report here.
Equity Curve
Nifty:
Bank Nifty:
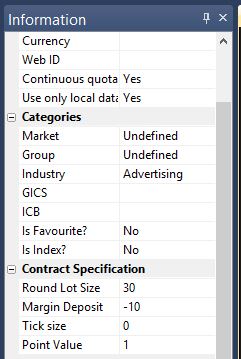
Additional Amibroker Settings for Backtesting
Go to Symbol → Information and specify the lot size and margin requirement. For example, lot size of 30 and margin requirement
of 10% for Bank Nifty: