

Being an off-floor trader might make you feel at a disadvantage compared to floor traders. They have firsthand access to market action, and their trading decisions are influenced by real-time events. You might often find yourself lacking essential information to make profitable trading decisions. However, don’t be disheartened, because making informed trading decisions is not as complex as it may seem, especially when you start incorporating the principles of Market Profile. Understanding the basics of market profile can help you find order within the chaos of price movements in the financial markets. This article serves as an introduction to the fundamental concepts of Market Profile, paving the way for a deeper understanding.
Read Also: Understanding Candlestick Patterns in Stock Analysis
Market Profile is not your typical trading indicator, providing buy or sell signals. Instead, it acts as a data-organizing tool, offering decision support. This data organization is invaluable in analyzing market movements and identifying the dominant forces driving price changes. Market Profile equips you with the insights needed to make informed trading decisions.
Deciphering Market Profile for Informed Trading Choices
Market Profile, in its essence, is constructed from TPOs (Time Price Opportunities). The first hour of a trading session often sets the tone for the entire day. This period is crucial for predicting the actions of floor traders. Market participants are primarily categorized into two groups:
- Day-timeframe traders
- Other-timeframe traders
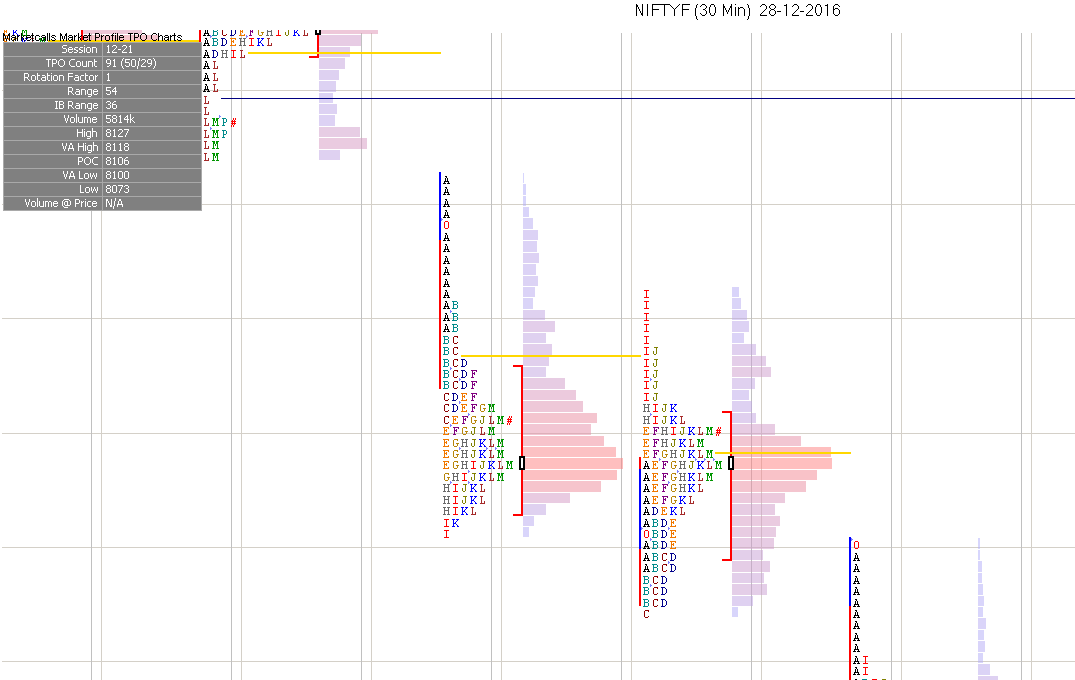
Day-timeframe traders include floor traders, while the rest belong to the category of other-timeframe traders. The Point of Control (POC) defines the price at which the majority of TPOs occurred in the Market Profile chart for the previous day. When trades take place within a narrow price range, it indicates a relatively balanced market. Other stocks tend to follow the pattern of the balance area, also known as the value area, where markets constantly update their value estimates.
A wide initial balance signifies a typical day and suggests that traders entered the market early. Major news often prompts such early entries, resulting in short-term bullish or bearish trends. However, the remainder of the day tends to remain balanced, with other-timeframe buyers and sellers engaging in trade.
Here is the Market Profile chart for Nifty from Marketcalls:
Unlocking the Practicality of Market Profile
Once you’ve gained experience in analyzing market profile data, the next step involves recognizing price directions and different types of trading days. While tick charts offer a straightforward way to represent data, market profile provides additional insights by amalgamating price, volume, and time to reveal a recognizable structure. Tick charts focus on the relationship between price and traded volume. Market profile, on the other hand, visualizes price levels at which the market achieves relative equilibrium.
By comparing the current day’s market profile to that of the previous day, traders can spot changes in price or volume. They can also identify divergences between price and value by thoroughly examining market profile basics. Moreover, observing movements within the value area allows traders to identify trends. If the value area moves in one direction, it signifies that the market is accepting the price movement.
It unveils various aspects of market behavior and facilitates monitoring trading activity. By closely monitoring market actions, you can gain insights into the type of trading day unfolding and spot the beginning of a price trend. Combining market profile analysis with moving averages and volume scrutiny can prove to be a winning strategy in your trading endeavors.


One Comment