
A Systematic Investment Plan (SIP) is an intelligent approach to investing in financial markets, where you regularly contribute a set amount (like monthly) into vehicles such as mutual funds or stocks. SIPs are remarkable for their ability to amplify wealth over time, thanks to the power of dollar-cost averaging. An interesting variant is the Step Up SIP, where you incrementally increase your investment amount every few months or years. This strategy significantly boosts the potential for higher earnings. In this article, we introduce the Step Up SIP Calculator Excel Sheet, a tool that simplifies the calculation of your enhanced SIP returns effortlessly.
For a simple SIP calculation (without step-up), check out this post to download a user-friendly Excel sheet:
How to Calculate SIP Returns in an Excel Sheet?
An Example of Step Up SIP in Action
Imagine an investor, John, who regularly invests $1,000 each month through a SIP in an index mutual fund. As a salaried employee, John enjoys an average 10% salary hike annually. He decides to increase his SIP investment by the same percentage yearly. Therefore, his monthly SIP investment grows to $1,100 in the second year, $1,210 in the third, and continues to rise. John is effectively optimizing his investment through step-up SIPs.
Let’s visualize John’s investment growth over the first five years:
Year 1: $1,000 x 12 = $12,000
Year 2: $1,100 x 12 = $13,200
Year 3: $1,210 x 12 = $14,520
Year 4: $1,331 x 12 = $15,972
Year 5: $1,464 x 12 = $17,568
Total Investment: $73,260
If John had maintained a constant $1,000 monthly SIP, his total investment over five years would have been $60,000, significantly less than $73,260 achieved with step-up SIP.
Understanding the Step Up SIP Calculator Excel Sheet
The Step Up SIP Calculator Excel Sheet is divided into two parts – the “Summary” and the “Month Wise Calculation” worksheets.
In the Summary worksheet, just input your investment details, and watch as it automatically calculates your “Total Investment,” “Final Capital,” and “Total Returns” for you.
Here’s a peek at what the Summary worksheet looks like:
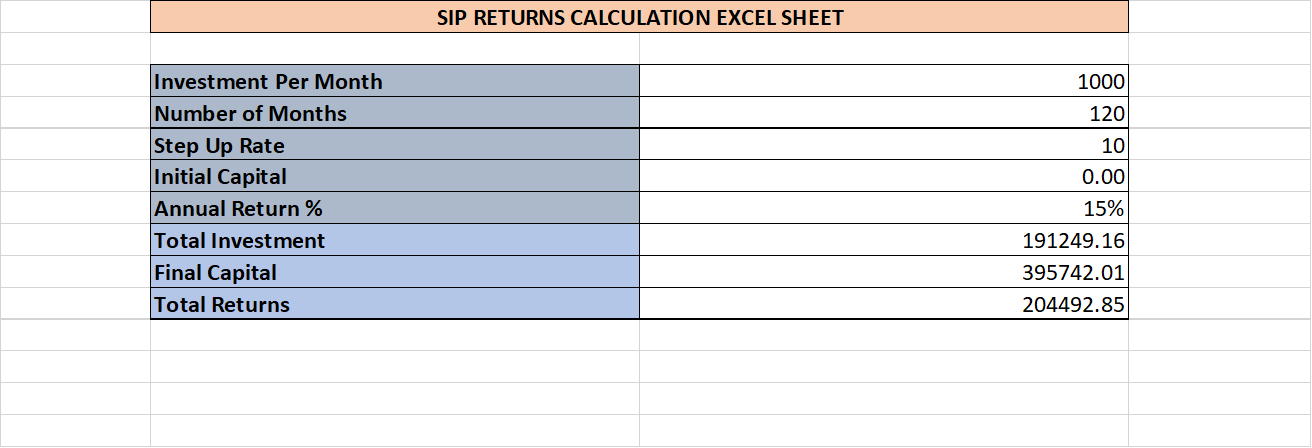
Key parameters to input manually in the sheet are:
- Investment Per Month – The amount you plan to start investing monthly through SIP.
- Number of Months – The total duration of your investment.
- Step Up Rate – The percentage by which you will increase your SIP annually.
- Initial Capital – Your initial investment.
- Annual Return % – The expected yearly return on your investment.
Based on these inputs, the Excel sheet effortlessly calculates:
- Total Investment – The aggregate amount invested at the end of the term.
- Final Capital – The eventual value of your investment considering the annual returns.
- Total Returns – The profit made, which is the difference between the total investment and final capital.
The “Month Wise Calculation” worksheet is where the detailed computations are performed to determine the final investment value.
Check out this snapshot of the Month Wise Calculation worksheet:
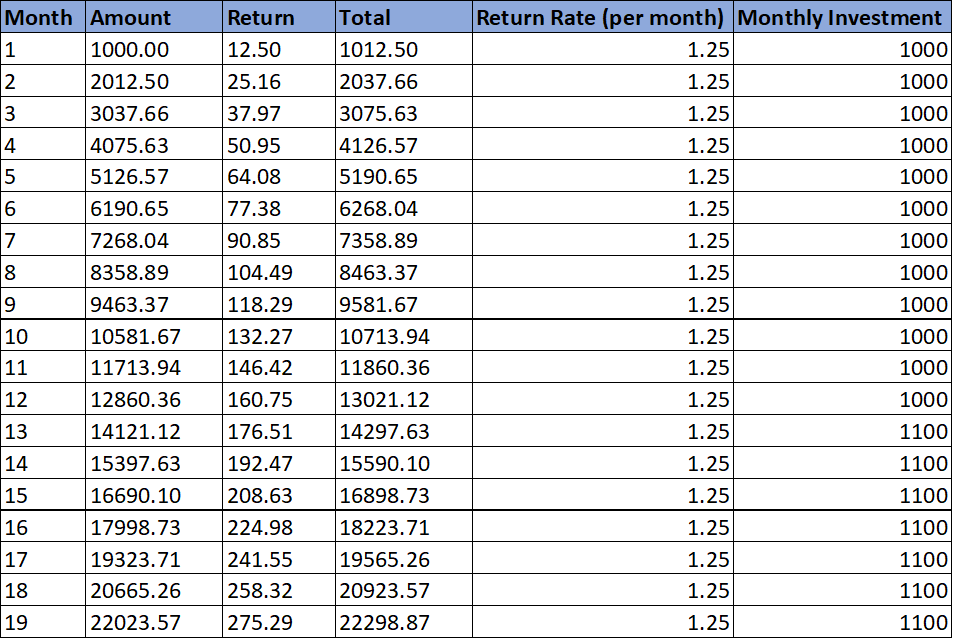
This sheet intricately calculates the monthly investment amount, the returns accrued, and the final total by referring to your input parameters. Notice the formula used in the “Monthly Investment” column, where the investment amount is incremented every 12 months.
Get Your Step Up SIP Calculator Excel Sheet
Access and download the sample Excel sheet to compute your Step Up SIP returns from this link: