
Let’s delve into another stock trading strategy utilizing Buy Sell signal generated within an Excel spreadsheet. This Excel sheet is semi-automated, requiring manual input of historical End-of-Day (EOD) data for the chosen stock. Once the data is entered, the Excel sheet will autonomously indicate Buy and Sell signals. This strategy hinges on support and resistance, assuming that three consecutive equal lows may trigger an upper breakout, while three consecutive equal highs may lead to a lower breakout. It performs effectively with low-priced stocks, typically those priced below 200 rupees.
Discover similar profitable Excel-based strategies here.
Overview of the Strategy
| Parameter | Value |
| Preferred Timeframe | EOD |
| Indicators Used | None |
| Buy Condition | Three consecutive equal lows in the Daily Timeframe. |
| Sell Condition | Three consecutive equal highs in the Daily Timeframe. |
| Stop Loss | As per your risk appetite |
| Targets | No fixed target. Depends on your money management strategy. |
Excel Sheet
| Parameter | Description | |
| Worksheet Name | ||
| Inputs | Column A, B, C, D, E, F, G | Date, Open, High, Low, Close, and Volume of the selected stock. This data must be manually entered. You can download it from Google Finance using this link. (This link is for downloading data for Idea Cellular). |
| Outputs | Rounded High/Low (Column G, H) | Rounded high/low values of the stock for that specific date. |
| Position (Column I) | Indicates whether you should take a Buy or Sell position. | |
| Buy/Sell Price (Column J, K) | Indicates the price at which the Buy/Sell position is taken. It corresponds to the Close price on the day when the Buy/Sell signal is generated. | |
| Buy/Sell (Column L, M) | Profit in percentage terms since the last Buy/Sell position was taken. | |
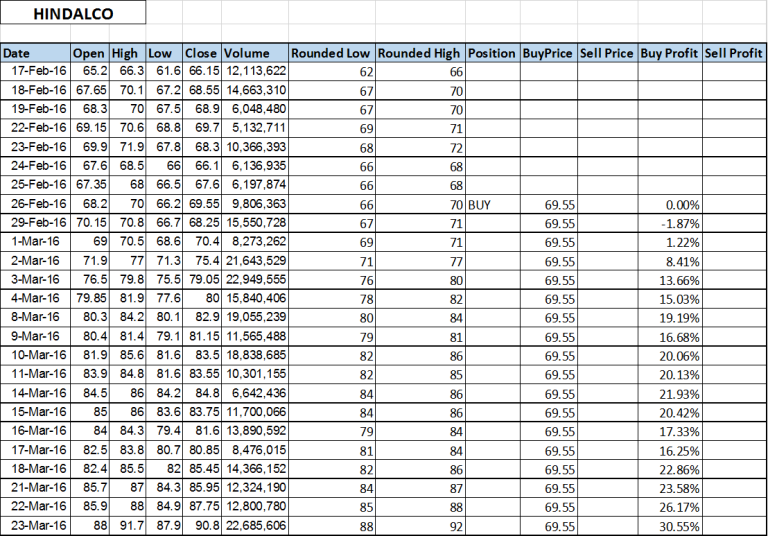
Screenshot
Take a look at the example below for Hindalco. The strategy accurately signaled a Buy on Feb 26. If a position was taken on Feb 26, it would have been 30% profitable by March 23.
How to Use this Excel Sheet
Step 1: Download the spreadsheet from the end of this post to your local computer.
Step 2: Open the sheet and manually input the EOD data for the selected stocks. The sample Excel contains data for Idea, Tata Power, and Hindalco.
Step 3: The sheet will automatically indicate Buy and Sell signals and calculate your profit/loss percentage.