The Golden Path: A Guide to Technical Analysis of Gold
Gold, the revered Yellow metal, is a bastion for conservative investors seeking safe havens. While many believe gold prices will always rise, it’s crucial to recognize that even gold can fluctuate. Influenced by supply, demand, and macroeconomic factors, gold prices are not immune to change. To navigate these waters, we turn to technical analysis, a tool to decipher gold’s price movements through chart analysis. This article will guide you through the nuances of technical analysis of Gold, teaching you to interpret various indicators and charts for precise gold price speculation.
Why Opt for Technical Analysis in Gold Trading?
Skepticism often greets the idea of predicting future prices through chart patterns and mathematical indicators, especially in gold trading, which attracts a different investor base than typical stock markets. Nonetheless, technical analysis is universally applicable. It harnesses historical data to understand how prices have responded to specific patterns or events, offering accurate future predictions.
Technical analysis operates on the principle that “Price discounts everything”. It examines current and past prices to infer future trends, a method particularly beneficial for gold, whose price movements are influenced by various international macroeconomic factors. By focusing on the charts, technical analysis of gold allows investors to bypass these external factors.
Further Reading: Elevate Your Trades: The Power of Technical Analysis
Executing Technical Analysis of Gold
Technical analysis principles are universal, with no specific alterations required for gold. The patterns and indicators effective for stocks are equally applicable to gold.
To simplify your approach, focus on patterns like Head and Shoulders, Double Tops, Bullish/Bearish Engulfing, Doji, and indicators such as Moving Average Crossovers, MACD, RSI. Employ these tools on higher timeframe charts for better insights, as gold’s price movements are not consistently volatile.
In many countries, gold is traded both as a commodity and as ETFs. Choose the one that aligns with your comfort and strategy.
Gold Futures Technical Analysis Dashboard
Examine the gold futures technical analysis dashboard from Investing.com:
https://in.investing.com/technical/commodities-technical-analysis
This comprehensive dashboard offers an aggregated view of gold-related technical indicators, each indicator’s sentiment, and the collective sentiment based on all indicators.
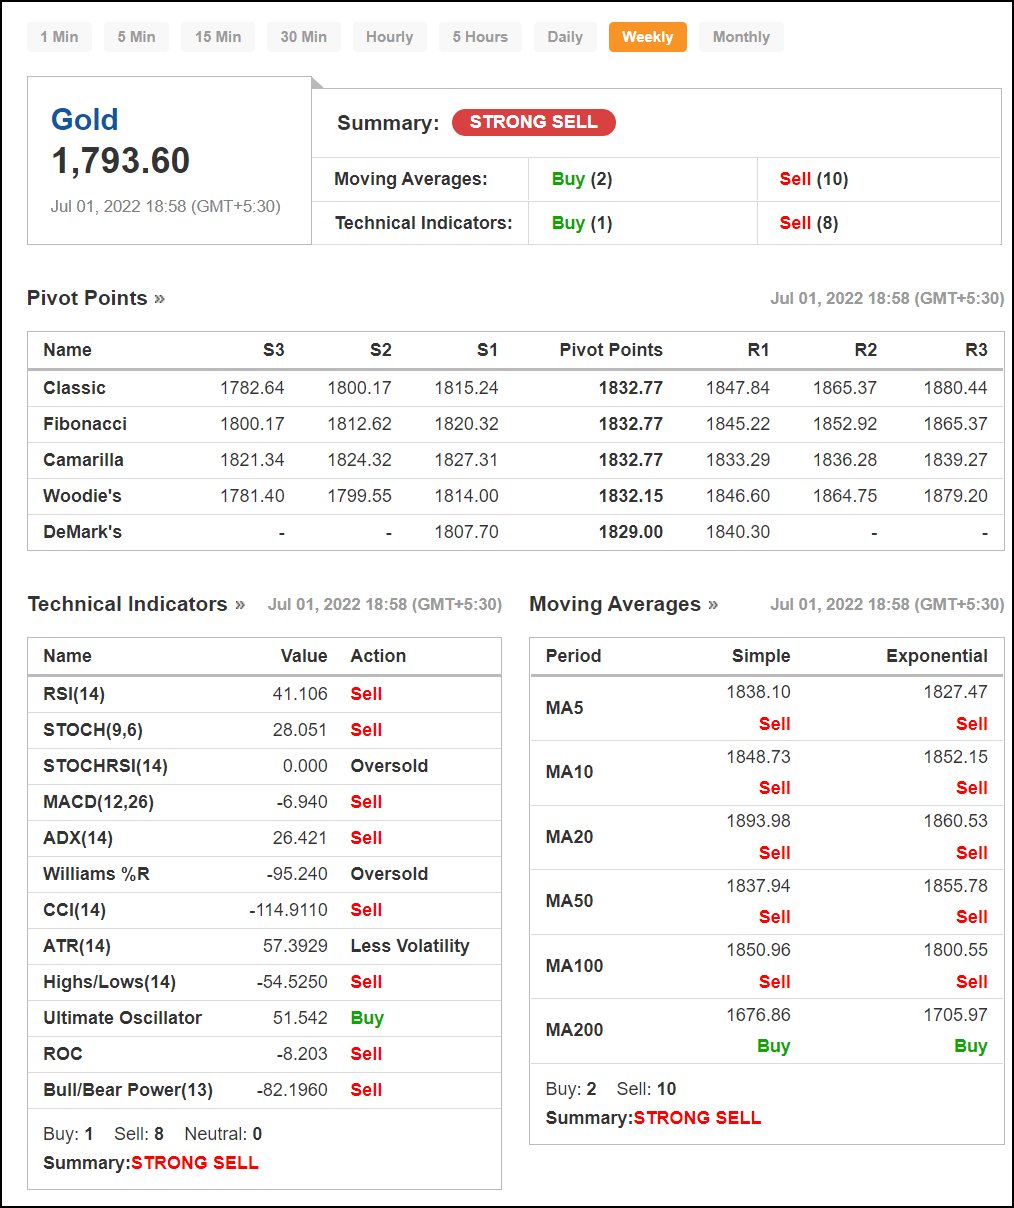
Active gold investors can greatly benefit from this dashboard. It’s a valuable tool to guide your buying and selling decisions based on the signals.
Related Article: The Trader’s Guide to Crude Oil Technical Analysis
Concluding Insights
Technical analysis is an indispensable tool for trading gold or any financial instrument. It offers a straightforward and highly accurate method to anticipate price movements. Though the concept of applying technical analysis to gold is relatively new and not widely adopted, it’s an innovative approach that warrants exploration.