
When diving into the financial markets, your main aim is to achieve “Alpha,” a key metric that measures your portfolio’s performance against the market. Aiming for a higher alpha gives you an “edge” over others. Often paired with Beta, Alpha assesses your portfolio’s overall risk. This article will guide you through calculating stock alpha in a spreadsheet. You can access a free, read-only version of the spreadsheet at the end of this post.
Exploring Stock Alpha
Let’s simplify Alpha with an example.
Imagine you’re an active stock market investor, and your portfolio yields an average 12% yearly return. In contrast, the broader market index, like S&P500, averages 8% during the same period.
Your portfolio’s Alpha value is 4%, indicating superior performance compared to the market index. However, a negative Alpha, indicating lower returns than the index, suggests a need for rebalancing for long-term market sustainability.
Standard Alpha calculations don’t factor in investment risks. That’s where Jansen’s Alpha is useful, as it considers the Beta value while calculating excess returns. We’ll delve deeper into this next.
Recommended Reading: Calculating Expectancy in Excel
Calculating Stock Alpha
Here’s how you calculate Jensen’s Alpha:
Jensen’s Alpha = Actual return – Risk-free return – Beta x (Benchmark return – Risk-free return)
The benchmark return often refers to standard indices like the S&P500 or Nifty50. The risk-free return, usually the return on a government Treasury bill, is the expected yield on a risk-free investment.
For instance, let’s say your portfolio has a 15% return, a Beta of 1.2, and the risk-free return is 4%, with the benchmark yielding 8%.
Alpha = 0.15 – 0.04 – 1.2 x (0.08-0.04)
= 0.062 or 6.2%
This 6.2% risk-adjusted Jensen’s Alpha compares to a standard alpha of 7% (15-8).
Spreadsheet Steps for Stock Alpha
To calculate stock alpha, we’ll use the Jensen’s Alpha formula in a spreadsheet. This spreadsheet builds on our previous stock beta calculation guide.
We employ Google Spreadsheet for its ability to fetch historical stock prices using the Google Finance function, eliminating manual data entry.
Let’s first explore the final spreadsheet before breaking down its creation:
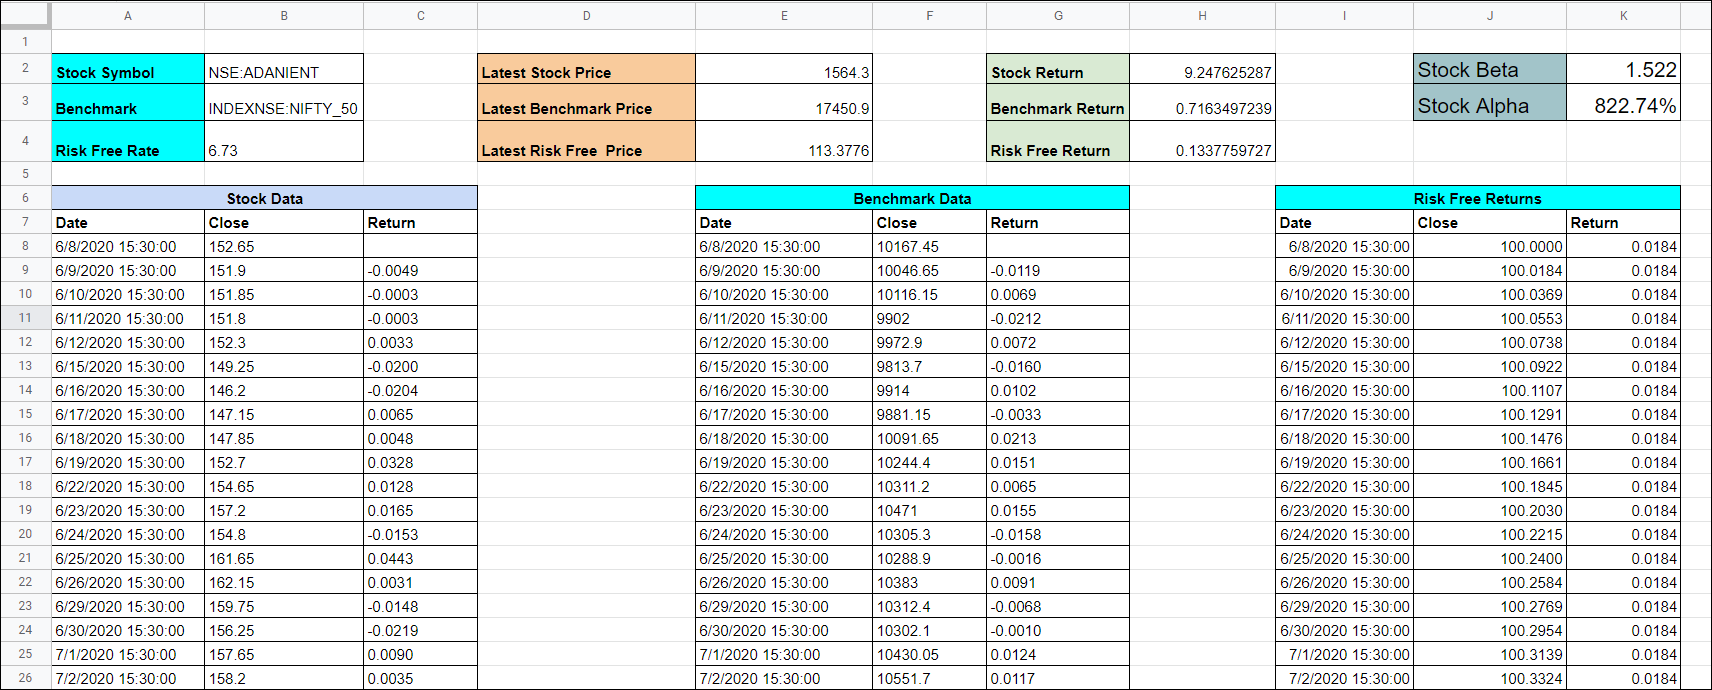
Cell B2 holds the stock symbol for Alpha calculation, such as NSE:ADANIENT. You can modify this to analyze any stock’s alpha.
Cell B3 contains the benchmark symbol NSE Nifty, while B4 has the risk-free rate. In Indian markets, the RBI 91-day Treasury bill rate is ideal, available here.
From row 6, the spreadsheet uses the Google Finance function to fetch closing prices for the stock and benchmark symbols.
The formula in cells A7 or E7 is as follows:
=GOOGLEFINANCE(B2, “close”, TODAY()-1000,TODAY())
This retrieves closing prices for the past 1000 days from “NSE:ADANIENT.” Gathering data for at least a year ensures accurate alpha calculation.
Cell I7 onwards details the risk-free return calculations, incrementing daily by a factor of (risk-free rate/365).
Ensure data collection covers the same period for the stock, benchmark, and risk-free return.
Cells H2, H3, and H4 tally returns for the stock, benchmark, and risk-free instrument, respectively.
Beta is calculated in cell K2:
=covariance.p(C:C,G:G)/VARP(G:G)
This measures the covariance of stock returns against benchmark returns, divided by the variance of benchmark returns.
Finally, cell K3 computes the alpha value:
=H2-H4-K2*(H3-H4)
Here, H2 is stock returns, H4 risk-free returns, K2 Beta value, and H3 benchmark returns.
Spreadsheet Access
This guide should give you a solid understanding of stock alpha calculation using a spreadsheet. Access the spreadsheet here: