

Decoding Stock Beta: Your Tool for Measuring Investment Risks
Beta is a vital measure investors consider before diving into stocks, mutual funds, or similar financial instruments. It gauges an asset’s volatility against a standard, helping you weigh the risks of your investment. This article walks you through a detailed process for stock beta calculation using a spreadsheet. Plus, there’s a free, ready-to-use spreadsheet at the end of this post.
Understanding Stock Beta
Investing in stocks is always a bit of a gamble due to market unpredictability. As stock markets are inherently volatile, it’s crucial to grasp the level of risk involved. This is where “Beta” comes into play, providing a measure of this risk.
Beta is a number that indicates a stock’s volatility. A beta greater than 1 suggests higher volatility and risk compared to the broader market. If you’re eyeing long-term investments, aim for stocks with a Beta of 1 or less. Conversely, for options trading, stocks with a higher beta are preferable due to potentially quicker premium decay.
Formula for Stock Beta Calculation
The formula for Beta involves dividing the covariance of a stock’s return with the benchmark’s return by the variance of the benchmark’s return over a specific period:
Beta = Covariance (Stock Return, Benchmark Return) / Variance (Benchmark Return)
Calculating Stock Beta in a Spreadsheet
We’ll use Google Sheets for this tutorial. Google Sheets conveniently fetches historical stock prices using the Google Finance function, eliminating manual data entry.
Let’s first check out the final look of the spreadsheet, then backtrack to its creation:
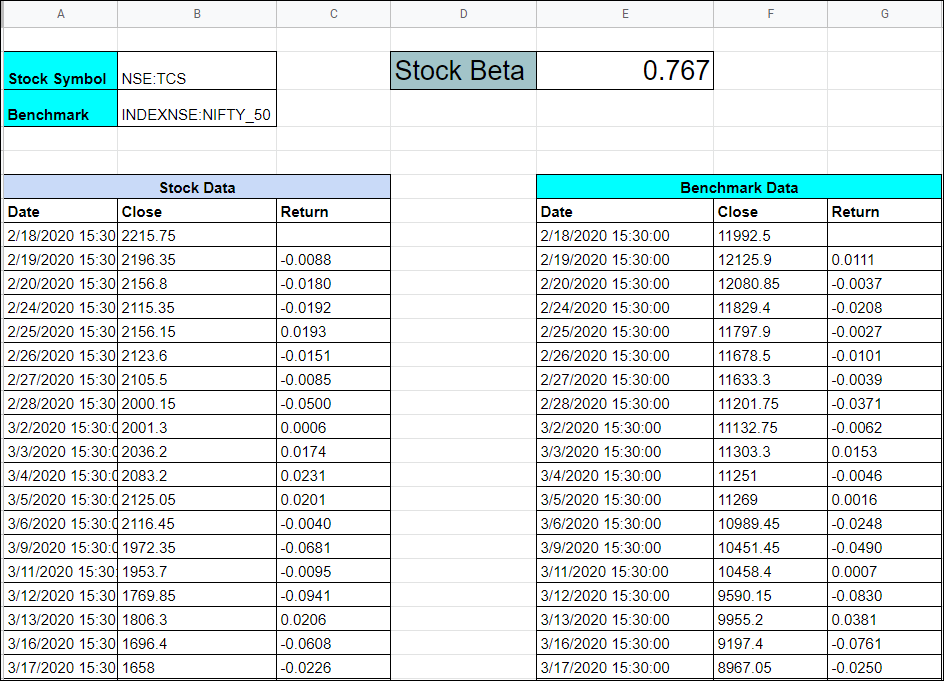
Cell B2 is where you enter the stock symbol, like NSE:TCS, for which you’re calculating Beta.
Cell A2 should hold your benchmark symbol, such as NSE Nifty.
Change these cells to calculate Beta for different stocks.
From row 6, we’ve pulled the closing prices for both the stock and benchmark symbols using Google Finance.
Check cells A7 or E7 for the data-fetching formula:
=GOOGLEFINANCE(B2, “close”, TODAY()-1000,TODAY())
This formula fetches the closing price for the past 1000 days. Remember, it’s best to have at least a year’s data for accurate Beta values.
Ensure you fetch data for the same period for both the stock and benchmark.
Columns C and G show daily return calculations, using this formula:
=(B9–B8)/B8
Beta is finally calculated in cell E2:
=covariance.p(C:C,G:G)/VARP(G:G)
This computes the covariance of stock returns against benchmark returns, divided by the variance of benchmark returns.
Get Your Spreadsheet Here
Now that you understand stock beta calculation, you can access and use the spreadsheet via this link:
Feel free to copy it for your financial analyses.


One Comment